Immigrants from Yemen vs Apache Vision Disability
COMPARE
Immigrants from Yemen
Apache
Vision Disability
Vision Disability Comparison
Immigrants from Yemen
Apache
2.6%
VISION DISABILITY
0.0/ 100
METRIC RATING
309th/ 347
METRIC RANK
3.0%
VISION DISABILITY
0.0/ 100
METRIC RATING
329th/ 347
METRIC RANK
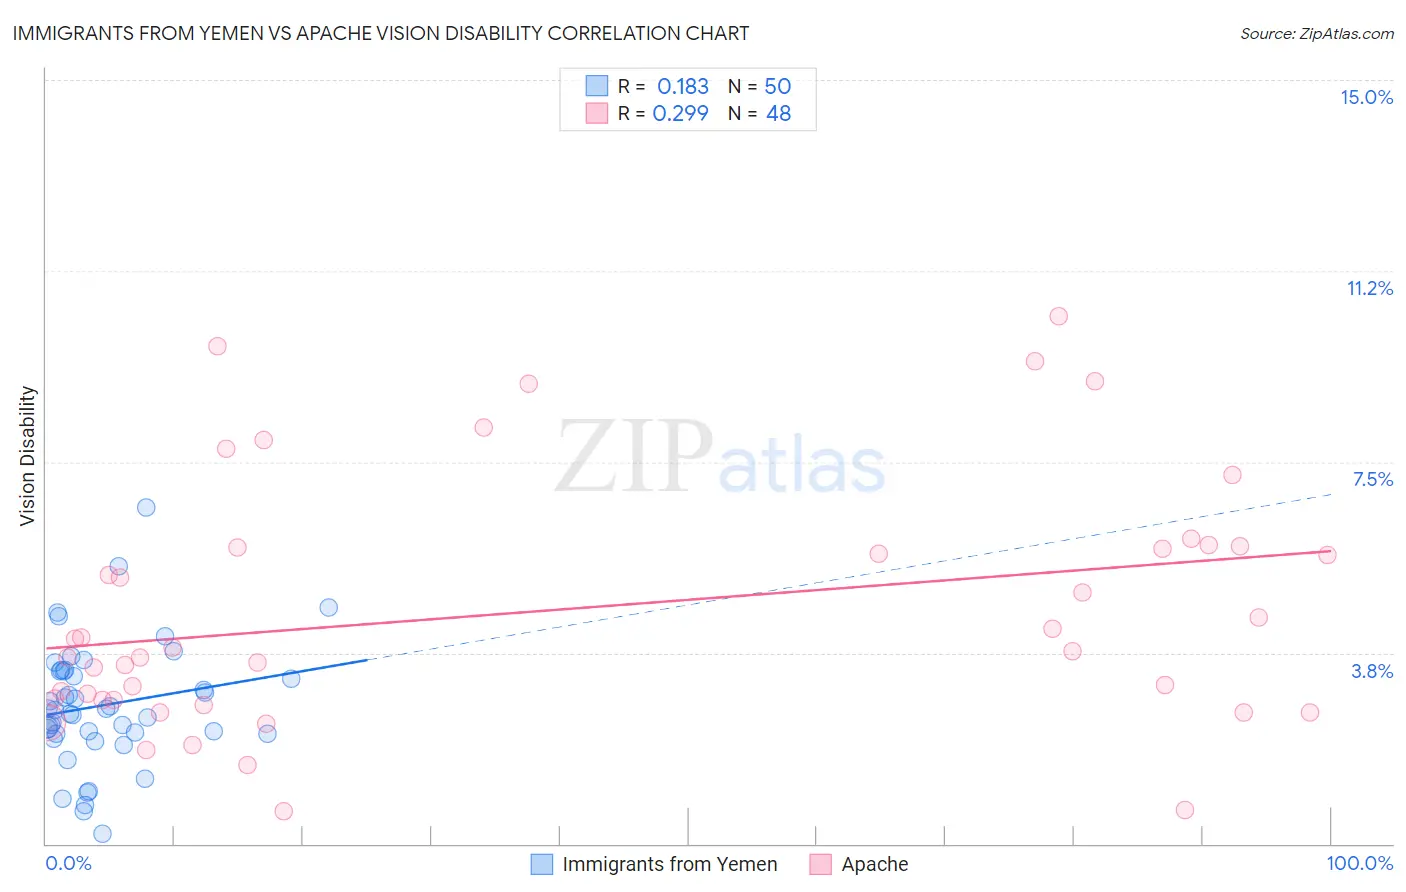
Immigrants from Yemen vs Apache Vision Disability Correlation Chart
The statistical analysis conducted on geographies consisting of 82,432,015 people shows a poor positive correlation between the proportion of Immigrants from Yemen and percentage of population with vision disability in the United States with a correlation coefficient (R) of 0.183 and weighted average of 2.6%. Similarly, the statistical analysis conducted on geographies consisting of 231,003,425 people shows a weak positive correlation between the proportion of Apache and percentage of population with vision disability in the United States with a correlation coefficient (R) of 0.299 and weighted average of 3.0%, a difference of 14.3%.
Vision Disability Correlation Summary
| Measurement | Immigrants from Yemen | Apache |
| Minimum | 0.20% | 0.65% |
| Maximum | 6.6% | 10.4% |
| Range | 6.4% | 9.7% |
| Mean | 2.7% | 4.6% |
| Median | 2.6% | 3.8% |
| Interquartile 25% (IQ1) | 2.2% | 2.8% |
| Interquartile 75% (IQ3) | 3.4% | 5.8% |
| Interquartile Range (IQR) | 1.2% | 3.0% |
| Standard Deviation (Sample) | 1.2% | 2.5% |
| Standard Deviation (Population) | 1.2% | 2.4% |
Demographics Similar to Immigrants from Yemen and Apache by Vision Disability
In terms of vision disability, the demographic groups most similar to Immigrants from Yemen are Blackfeet (2.6%, a difference of 0.32%), Dominican (2.6%, a difference of 0.37%), American (2.6%, a difference of 1.2%), Potawatomi (2.6%, a difference of 1.2%), and Inupiat (2.7%, a difference of 1.3%). Similarly, the demographic groups most similar to Apache are Yuman (3.0%, a difference of 0.19%), Native/Alaskan (3.0%, a difference of 0.74%), Spanish American (2.9%, a difference of 1.5%), Cherokee (2.9%, a difference of 2.7%), and Hopi (2.9%, a difference of 2.7%).
| Demographics | Rating | Rank | Vision Disability |
| Immigrants | Yemen | 0.0 /100 | #309 | Tragic 2.6% |
| Blackfeet | 0.0 /100 | #310 | Tragic 2.6% |
| Dominicans | 0.0 /100 | #311 | Tragic 2.6% |
| Americans | 0.0 /100 | #312 | Tragic 2.6% |
| Potawatomi | 0.0 /100 | #313 | Tragic 2.6% |
| Inupiat | 0.0 /100 | #314 | Tragic 2.7% |
| Osage | 0.0 /100 | #315 | Tragic 2.7% |
| Shoshone | 0.0 /100 | #316 | Tragic 2.7% |
| Yup'ik | 0.0 /100 | #317 | Tragic 2.7% |
| Alaska Natives | 0.0 /100 | #318 | Tragic 2.7% |
| Tohono O'odham | 0.0 /100 | #319 | Tragic 2.8% |
| Blacks/African Americans | 0.0 /100 | #320 | Tragic 2.8% |
| Comanche | 0.0 /100 | #321 | Tragic 2.8% |
| Paiute | 0.0 /100 | #322 | Tragic 2.9% |
| Tlingit-Haida | 0.0 /100 | #323 | Tragic 2.9% |
| Hopi | 0.0 /100 | #324 | Tragic 2.9% |
| Cherokee | 0.0 /100 | #325 | Tragic 2.9% |
| Spanish Americans | 0.0 /100 | #326 | Tragic 2.9% |
| Natives/Alaskans | 0.0 /100 | #327 | Tragic 3.0% |
| Yuman | 0.0 /100 | #328 | Tragic 3.0% |
| Apache | 0.0 /100 | #329 | Tragic 3.0% |