Immigrants from Barbados vs Apache Vision Disability
COMPARE
Immigrants from Barbados
Apache
Vision Disability
Vision Disability Comparison
Immigrants from Barbados
Apache
2.2%
VISION DISABILITY
24.0/ 100
METRIC RATING
194th/ 347
METRIC RANK
3.0%
VISION DISABILITY
0.0/ 100
METRIC RATING
329th/ 347
METRIC RANK
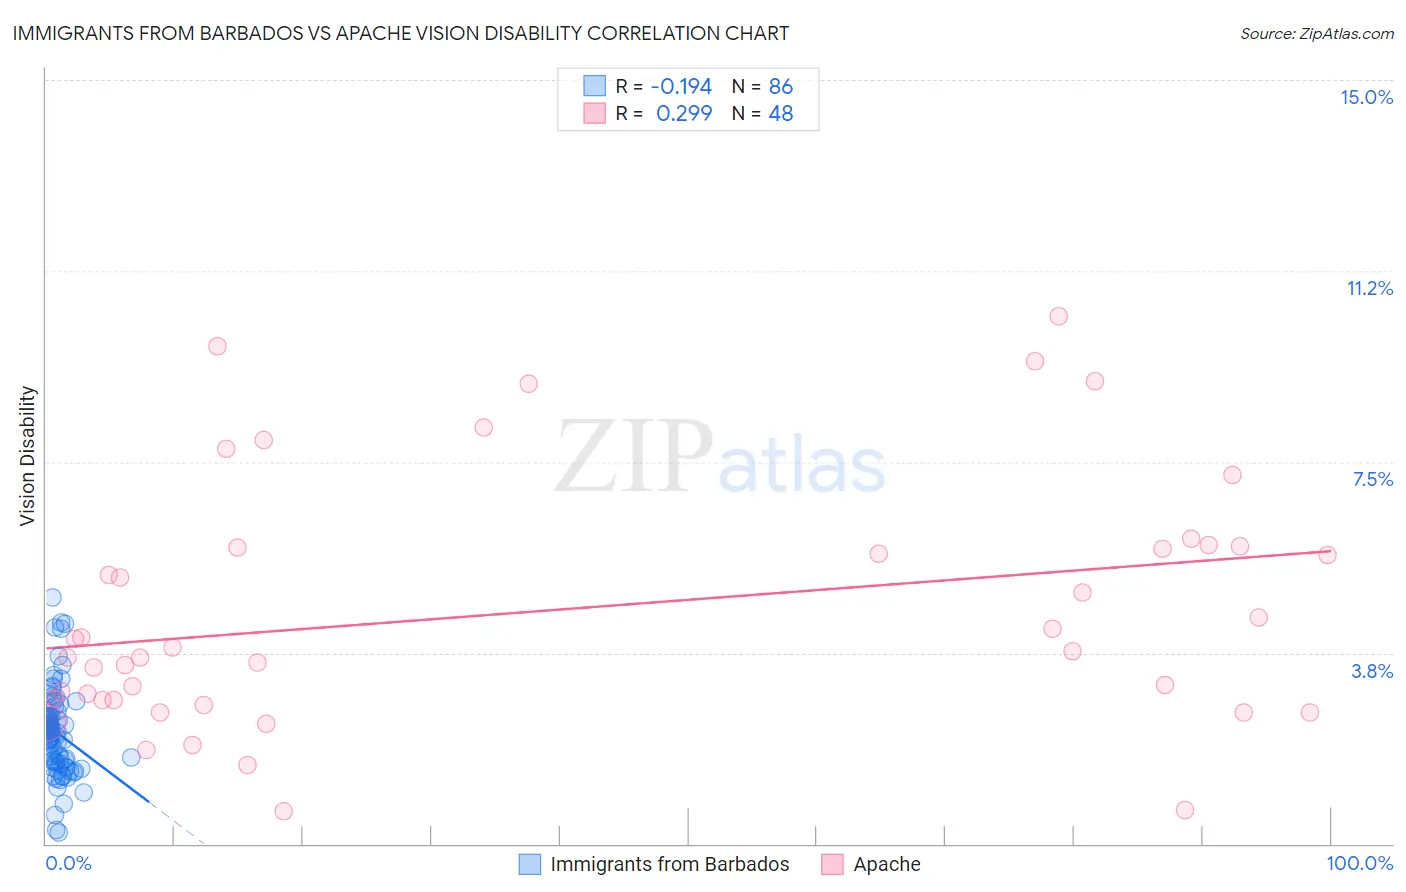
Immigrants from Barbados vs Apache Vision Disability Correlation Chart
The statistical analysis conducted on geographies consisting of 112,772,018 people shows a poor negative correlation between the proportion of Immigrants from Barbados and percentage of population with vision disability in the United States with a correlation coefficient (R) of -0.194 and weighted average of 2.2%. Similarly, the statistical analysis conducted on geographies consisting of 231,003,425 people shows a weak positive correlation between the proportion of Apache and percentage of population with vision disability in the United States with a correlation coefficient (R) of 0.299 and weighted average of 3.0%, a difference of 35.6%.
Vision Disability Correlation Summary
| Measurement | Immigrants from Barbados | Apache |
| Minimum | 0.23% | 0.65% |
| Maximum | 4.8% | 10.4% |
| Range | 4.6% | 9.7% |
| Mean | 2.2% | 4.6% |
| Median | 2.2% | 3.8% |
| Interquartile 25% (IQ1) | 1.6% | 2.8% |
| Interquartile 75% (IQ3) | 2.5% | 5.8% |
| Interquartile Range (IQR) | 0.91% | 3.0% |
| Standard Deviation (Sample) | 0.87% | 2.5% |
| Standard Deviation (Population) | 0.87% | 2.4% |
Similar Demographics by Vision Disability
Demographics Similar to Immigrants from Barbados by Vision Disability
In terms of vision disability, the demographic groups most similar to Immigrants from Barbados are Immigrants (2.2%, a difference of 0.020%), Immigrants from Grenada (2.2%, a difference of 0.070%), British (2.2%, a difference of 0.090%), Canadian (2.2%, a difference of 0.15%), and European (2.2%, a difference of 0.15%).
| Demographics | Rating | Rank | Vision Disability |
| Immigrants | St. Vincent and the Grenadines | 30.3 /100 | #187 | Fair 2.2% |
| Guyanese | 28.9 /100 | #188 | Fair 2.2% |
| Salvadorans | 27.4 /100 | #189 | Fair 2.2% |
| Immigrants | Costa Rica | 26.1 /100 | #190 | Fair 2.2% |
| Canadians | 25.8 /100 | #191 | Fair 2.2% |
| Europeans | 25.7 /100 | #192 | Fair 2.2% |
| British | 25.1 /100 | #193 | Fair 2.2% |
| Immigrants | Barbados | 24.0 /100 | #194 | Fair 2.2% |
| Immigrants | Immigrants | 23.7 /100 | #195 | Fair 2.2% |
| Immigrants | Grenada | 23.1 /100 | #196 | Fair 2.2% |
| Ghanaians | 21.8 /100 | #197 | Fair 2.2% |
| Czechoslovakians | 21.6 /100 | #198 | Fair 2.2% |
| Immigrants | El Salvador | 21.0 /100 | #199 | Fair 2.2% |
| Immigrants | Thailand | 20.1 /100 | #200 | Fair 2.2% |
| Slovaks | 18.8 /100 | #201 | Poor 2.2% |
Demographics Similar to Apache by Vision Disability
In terms of vision disability, the demographic groups most similar to Apache are Yuman (3.0%, a difference of 0.19%), Native/Alaskan (3.0%, a difference of 0.74%), Colville (3.0%, a difference of 1.2%), Spanish American (2.9%, a difference of 1.5%), and Central American Indian (3.0%, a difference of 1.8%).
| Demographics | Rating | Rank | Vision Disability |
| Paiute | 0.0 /100 | #322 | Tragic 2.9% |
| Tlingit-Haida | 0.0 /100 | #323 | Tragic 2.9% |
| Hopi | 0.0 /100 | #324 | Tragic 2.9% |
| Cherokee | 0.0 /100 | #325 | Tragic 2.9% |
| Spanish Americans | 0.0 /100 | #326 | Tragic 2.9% |
| Natives/Alaskans | 0.0 /100 | #327 | Tragic 3.0% |
| Yuman | 0.0 /100 | #328 | Tragic 3.0% |
| Apache | 0.0 /100 | #329 | Tragic 3.0% |
| Colville | 0.0 /100 | #330 | Tragic 3.0% |
| Central American Indians | 0.0 /100 | #331 | Tragic 3.0% |
| Seminole | 0.0 /100 | #332 | Tragic 3.1% |
| Cajuns | 0.0 /100 | #333 | Tragic 3.1% |
| Cheyenne | 0.0 /100 | #334 | Tragic 3.1% |
| Navajo | 0.0 /100 | #335 | Tragic 3.1% |
| Alaskan Athabascans | 0.0 /100 | #336 | Tragic 3.1% |