Immigrants from Taiwan vs Spanish American Female Disability
COMPARE
Immigrants from Taiwan
Spanish American
Female Disability
Female Disability Comparison
Immigrants from Taiwan
Spanish Americans
10.1%
FEMALE DISABILITY
100.0/ 100
METRIC RATING
3rd/ 347
METRIC RANK
14.0%
FEMALE DISABILITY
0.0/ 100
METRIC RATING
316th/ 347
METRIC RANK
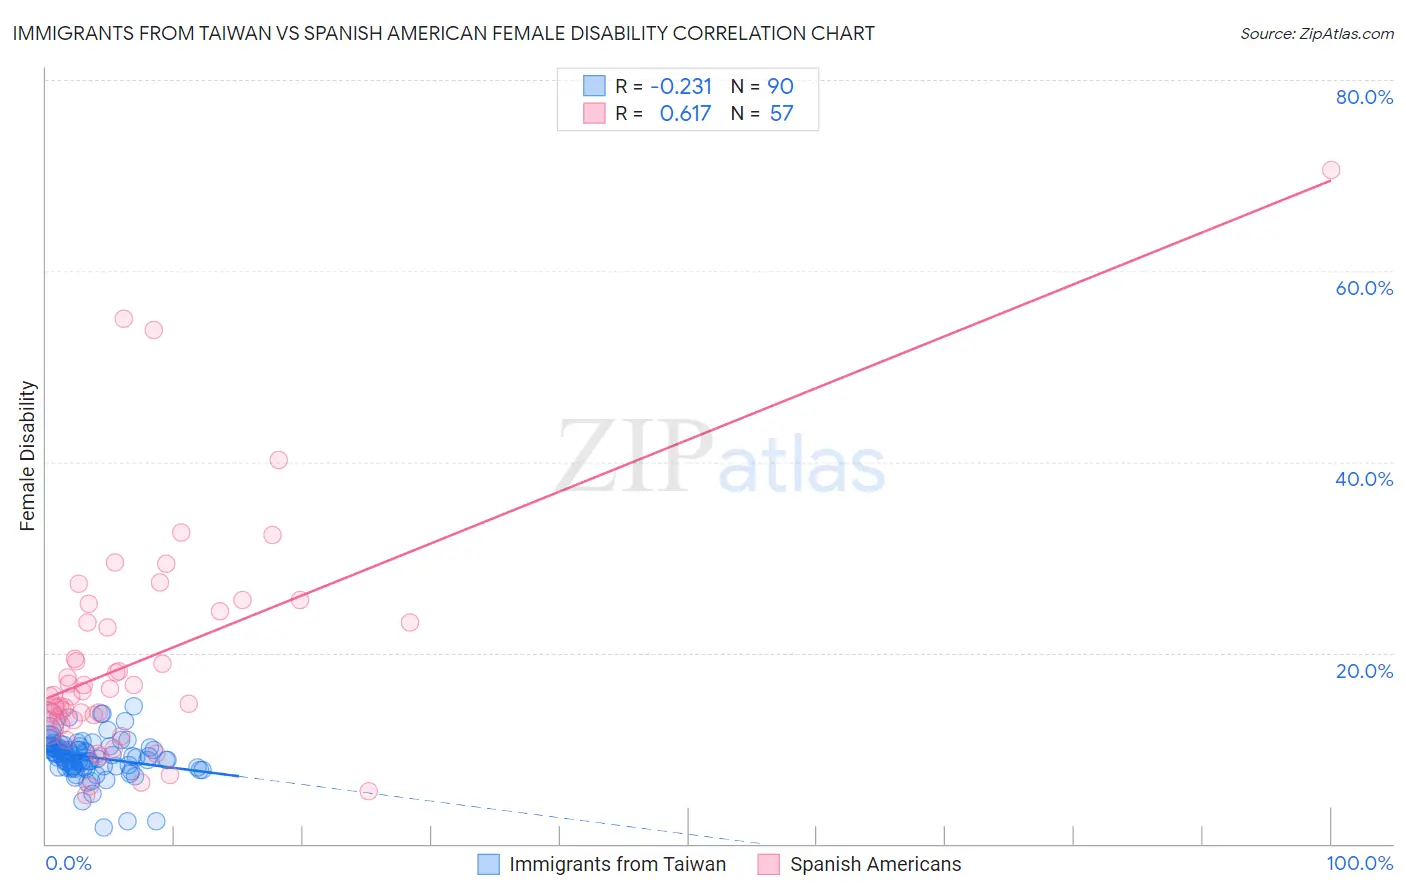
Immigrants from Taiwan vs Spanish American Female Disability Correlation Chart
The statistical analysis conducted on geographies consisting of 298,238,185 people shows a weak negative correlation between the proportion of Immigrants from Taiwan and percentage of females with a disability in the United States with a correlation coefficient (R) of -0.231 and weighted average of 10.1%. Similarly, the statistical analysis conducted on geographies consisting of 103,163,564 people shows a significant positive correlation between the proportion of Spanish Americans and percentage of females with a disability in the United States with a correlation coefficient (R) of 0.617 and weighted average of 14.0%, a difference of 38.6%.
Female Disability Correlation Summary
| Measurement | Immigrants from Taiwan | Spanish American |
| Minimum | 1.7% | 5.1% |
| Maximum | 14.4% | 70.6% |
| Range | 12.7% | 65.5% |
| Mean | 9.1% | 19.3% |
| Median | 9.1% | 15.6% |
| Interquartile 25% (IQ1) | 8.0% | 12.9% |
| Interquartile 75% (IQ3) | 10.1% | 23.8% |
| Interquartile Range (IQR) | 2.1% | 10.8% |
| Standard Deviation (Sample) | 2.2% | 12.2% |
| Standard Deviation (Population) | 2.2% | 12.1% |
Similar Demographics by Female Disability
Demographics Similar to Immigrants from Taiwan by Female Disability
In terms of female disability, the demographic groups most similar to Immigrants from Taiwan are Filipino (10.1%, a difference of 0.23%), Thai (10.2%, a difference of 0.88%), Immigrants from India (10.0%, a difference of 1.2%), Immigrants from Bolivia (10.3%, a difference of 1.7%), and Bolivian (10.4%, a difference of 2.6%).
| Demographics | Rating | Rank | Female Disability |
| Immigrants | India | 100.0 /100 | #1 | Exceptional 10.0% |
| Filipinos | 100.0 /100 | #2 | Exceptional 10.1% |
| Immigrants | Taiwan | 100.0 /100 | #3 | Exceptional 10.1% |
| Thais | 100.0 /100 | #4 | Exceptional 10.2% |
| Immigrants | Bolivia | 100.0 /100 | #5 | Exceptional 10.3% |
| Bolivians | 100.0 /100 | #6 | Exceptional 10.4% |
| Immigrants | Singapore | 100.0 /100 | #7 | Exceptional 10.4% |
| Immigrants | South Central Asia | 100.0 /100 | #8 | Exceptional 10.5% |
| Iranians | 100.0 /100 | #9 | Exceptional 10.6% |
| Immigrants | Hong Kong | 100.0 /100 | #10 | Exceptional 10.6% |
| Immigrants | Korea | 100.0 /100 | #11 | Exceptional 10.6% |
| Immigrants | Israel | 100.0 /100 | #12 | Exceptional 10.7% |
| Immigrants | Eastern Asia | 100.0 /100 | #13 | Exceptional 10.7% |
| Immigrants | China | 100.0 /100 | #14 | Exceptional 10.7% |
| Burmese | 100.0 /100 | #15 | Exceptional 10.7% |
Demographics Similar to Spanish Americans by Female Disability
In terms of female disability, the demographic groups most similar to Spanish Americans are Chippewa (14.0%, a difference of 0.11%), Paiute (14.0%, a difference of 0.22%), Alaskan Athabascan (13.9%, a difference of 0.36%), Iroquois (14.0%, a difference of 0.50%), and American (14.1%, a difference of 0.85%).
| Demographics | Rating | Rank | Female Disability |
| French American Indians | 0.0 /100 | #309 | Tragic 13.7% |
| Apache | 0.0 /100 | #310 | Tragic 13.7% |
| Hopi | 0.0 /100 | #311 | Tragic 13.7% |
| Delaware | 0.0 /100 | #312 | Tragic 13.8% |
| Blackfeet | 0.0 /100 | #313 | Tragic 13.8% |
| Puget Sound Salish | 0.0 /100 | #314 | Tragic 13.8% |
| Alaskan Athabascans | 0.0 /100 | #315 | Tragic 13.9% |
| Spanish Americans | 0.0 /100 | #316 | Tragic 14.0% |
| Chippewa | 0.0 /100 | #317 | Tragic 14.0% |
| Paiute | 0.0 /100 | #318 | Tragic 14.0% |
| Iroquois | 0.0 /100 | #319 | Tragic 14.0% |
| Americans | 0.0 /100 | #320 | Tragic 14.1% |
| Potawatomi | 0.0 /100 | #321 | Tragic 14.1% |
| Pueblo | 0.0 /100 | #322 | Tragic 14.1% |
| Blacks/African Americans | 0.0 /100 | #323 | Tragic 14.1% |