Shoshone vs Immigrants from China Self-Care Disability
COMPARE
Shoshone
Immigrants from China
Self-Care Disability
Self-Care Disability Comparison
Shoshone
Immigrants from China
2.7%
SELF-CARE DISABILITY
0.2/ 100
METRIC RATING
262nd/ 347
METRIC RANK
2.3%
SELF-CARE DISABILITY
99.1/ 100
METRIC RATING
76th/ 347
METRIC RANK
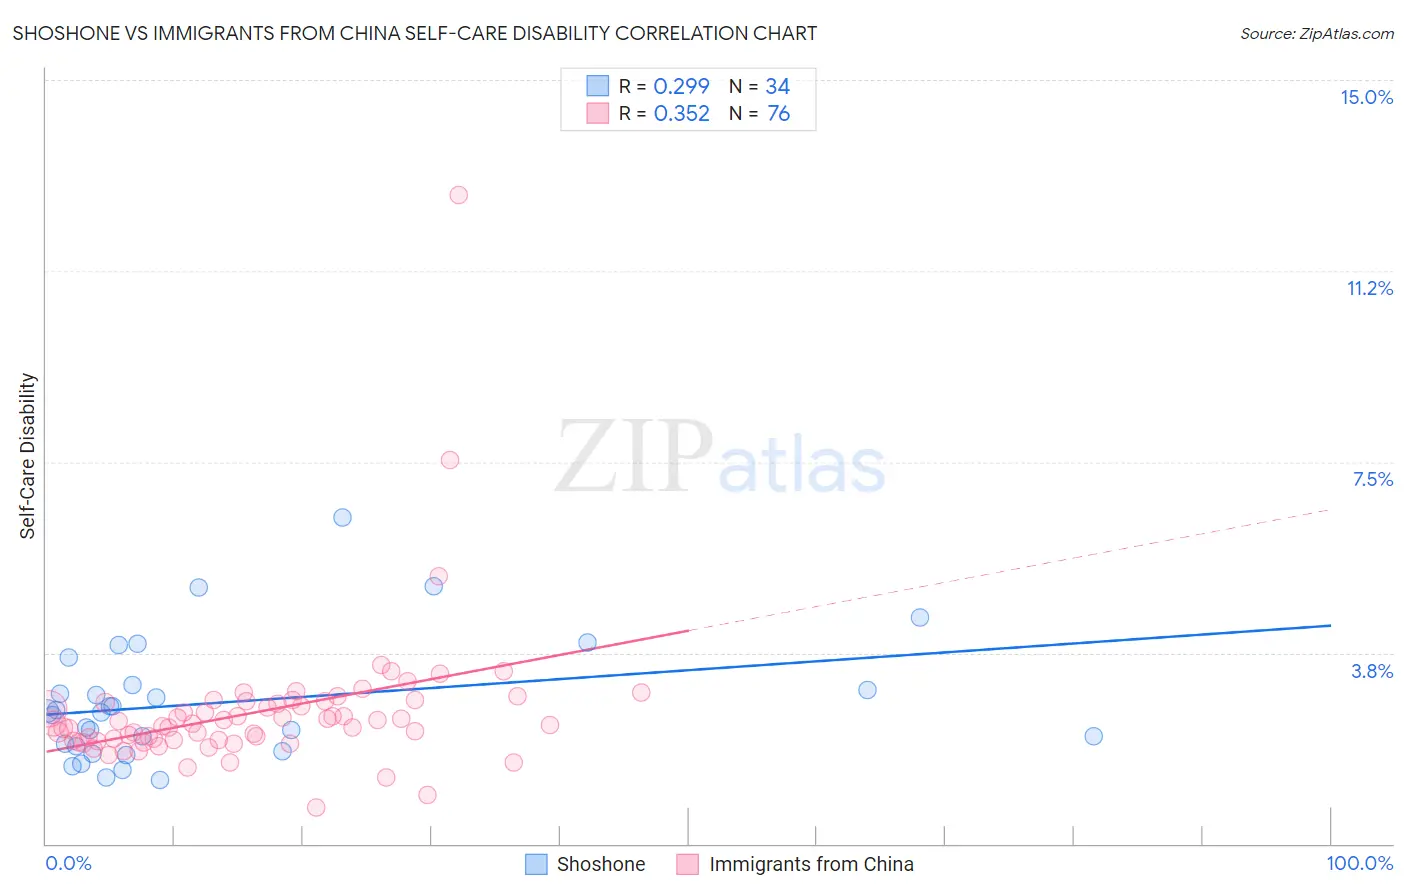
Shoshone vs Immigrants from China Self-Care Disability Correlation Chart
The statistical analysis conducted on geographies consisting of 66,602,843 people shows a weak positive correlation between the proportion of Shoshone and percentage of population with self-care disability in the United States with a correlation coefficient (R) of 0.299 and weighted average of 2.7%. Similarly, the statistical analysis conducted on geographies consisting of 456,266,069 people shows a mild positive correlation between the proportion of Immigrants from China and percentage of population with self-care disability in the United States with a correlation coefficient (R) of 0.352 and weighted average of 2.3%, a difference of 13.7%.
Self-Care Disability Correlation Summary
| Measurement | Shoshone | Immigrants from China |
| Minimum | 1.3% | 0.71% |
| Maximum | 6.4% | 12.8% |
| Range | 5.2% | 12.0% |
| Mean | 2.8% | 2.6% |
| Median | 2.6% | 2.3% |
| Interquartile 25% (IQ1) | 1.9% | 2.0% |
| Interquartile 75% (IQ3) | 3.1% | 2.8% |
| Interquartile Range (IQR) | 1.2% | 0.75% |
| Standard Deviation (Sample) | 1.2% | 1.5% |
| Standard Deviation (Population) | 1.2% | 1.4% |
Similar Demographics by Self-Care Disability
Demographics Similar to Shoshone by Self-Care Disability
In terms of self-care disability, the demographic groups most similar to Shoshone are Immigrants from Latin America (2.7%, a difference of 0.070%), Immigrants from Iran (2.7%, a difference of 0.13%), Arapaho (2.6%, a difference of 0.14%), Chippewa (2.6%, a difference of 0.16%), and Immigrants from Belarus (2.6%, a difference of 0.20%).
| Demographics | Rating | Rank | Self-Care Disability |
| Tsimshian | 0.3 /100 | #255 | Tragic 2.6% |
| Immigrants | Central America | 0.3 /100 | #256 | Tragic 2.6% |
| Potawatomi | 0.3 /100 | #257 | Tragic 2.6% |
| Immigrants | Nonimmigrants | 0.3 /100 | #258 | Tragic 2.6% |
| Immigrants | Belarus | 0.2 /100 | #259 | Tragic 2.6% |
| Chippewa | 0.2 /100 | #260 | Tragic 2.6% |
| Arapaho | 0.2 /100 | #261 | Tragic 2.6% |
| Shoshone | 0.2 /100 | #262 | Tragic 2.7% |
| Immigrants | Latin America | 0.2 /100 | #263 | Tragic 2.7% |
| Immigrants | Iran | 0.2 /100 | #264 | Tragic 2.7% |
| Immigrants | Nicaragua | 0.2 /100 | #265 | Tragic 2.7% |
| Immigrants | Cambodia | 0.1 /100 | #266 | Tragic 2.7% |
| Yaqui | 0.1 /100 | #267 | Tragic 2.7% |
| Immigrants | Mexico | 0.1 /100 | #268 | Tragic 2.7% |
| U.S. Virgin Islanders | 0.1 /100 | #269 | Tragic 2.7% |
Demographics Similar to Immigrants from China by Self-Care Disability
In terms of self-care disability, the demographic groups most similar to Immigrants from China are Immigrants from Netherlands (2.3%, a difference of 0.010%), Immigrants from Switzerland (2.3%, a difference of 0.050%), Immigrants from Middle Africa (2.3%, a difference of 0.080%), Immigrants from Ireland (2.3%, a difference of 0.080%), and Immigrants from Kenya (2.3%, a difference of 0.090%).
| Demographics | Rating | Rank | Self-Care Disability |
| Immigrants | Norway | 99.2 /100 | #69 | Exceptional 2.3% |
| Immigrants | Northern Europe | 99.2 /100 | #70 | Exceptional 2.3% |
| Asians | 99.2 /100 | #71 | Exceptional 2.3% |
| Eastern Europeans | 99.2 /100 | #72 | Exceptional 2.3% |
| Immigrants | Egypt | 99.1 /100 | #73 | Exceptional 2.3% |
| Immigrants | Switzerland | 99.1 /100 | #74 | Exceptional 2.3% |
| Immigrants | Netherlands | 99.1 /100 | #75 | Exceptional 2.3% |
| Immigrants | China | 99.1 /100 | #76 | Exceptional 2.3% |
| Immigrants | Middle Africa | 99.0 /100 | #77 | Exceptional 2.3% |
| Immigrants | Ireland | 99.0 /100 | #78 | Exceptional 2.3% |
| Immigrants | Kenya | 99.0 /100 | #79 | Exceptional 2.3% |
| Chileans | 98.8 /100 | #80 | Exceptional 2.3% |
| Ugandans | 98.8 /100 | #81 | Exceptional 2.3% |
| Immigrants | Denmark | 98.8 /100 | #82 | Exceptional 2.3% |
| Indians (Asian) | 98.7 /100 | #83 | Exceptional 2.3% |