Serbian vs Cypriot Vision Disability
COMPARE
Serbian
Cypriot
Vision Disability
Vision Disability Comparison
Serbians
Cypriots
2.1%
VISION DISABILITY
70.2/ 100
METRIC RATING
157th/ 347
METRIC RANK
2.0%
VISION DISABILITY
99.7/ 100
METRIC RATING
41st/ 347
METRIC RANK
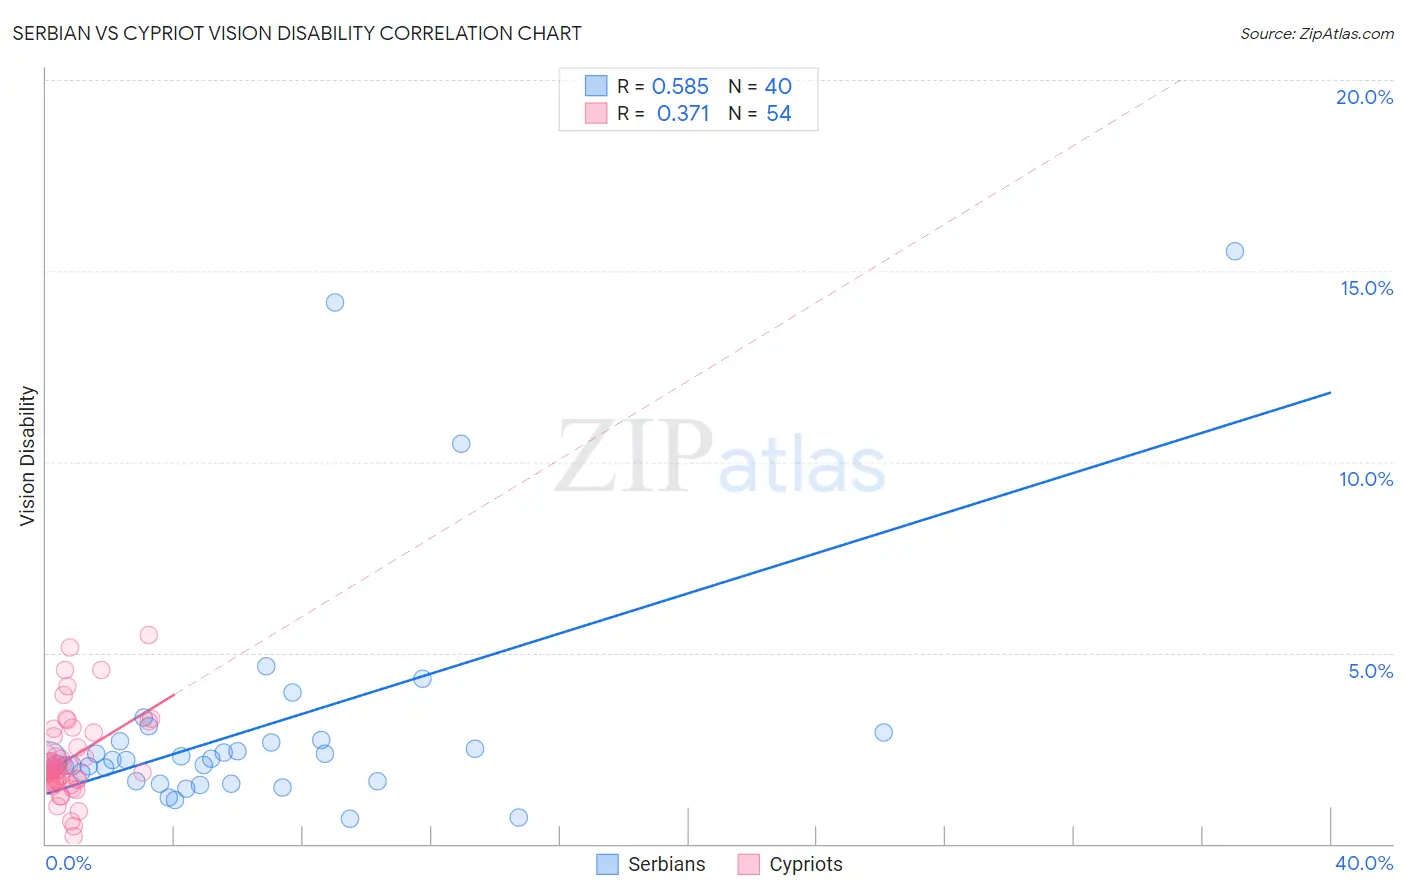
Serbian vs Cypriot Vision Disability Correlation Chart
The statistical analysis conducted on geographies consisting of 267,561,592 people shows a substantial positive correlation between the proportion of Serbians and percentage of population with vision disability in the United States with a correlation coefficient (R) of 0.585 and weighted average of 2.1%. Similarly, the statistical analysis conducted on geographies consisting of 61,856,516 people shows a mild positive correlation between the proportion of Cypriots and percentage of population with vision disability in the United States with a correlation coefficient (R) of 0.371 and weighted average of 2.0%, a difference of 8.7%.
Vision Disability Correlation Summary
| Measurement | Serbian | Cypriot |
| Minimum | 0.66% | 0.21% |
| Maximum | 15.5% | 5.5% |
| Range | 14.8% | 5.3% |
| Mean | 3.1% | 2.2% |
| Median | 2.2% | 1.9% |
| Interquartile 25% (IQ1) | 1.6% | 1.6% |
| Interquartile 75% (IQ3) | 2.7% | 2.8% |
| Interquartile Range (IQR) | 1.1% | 1.2% |
| Standard Deviation (Sample) | 3.1% | 1.1% |
| Standard Deviation (Population) | 3.1% | 1.1% |
Similar Demographics by Vision Disability
Demographics Similar to Serbians by Vision Disability
In terms of vision disability, the demographic groups most similar to Serbians are Immigrants from Uzbekistan (2.1%, a difference of 0.030%), South African (2.1%, a difference of 0.030%), Austrian (2.1%, a difference of 0.090%), Pakistani (2.1%, a difference of 0.11%), and Immigrants from Colombia (2.1%, a difference of 0.14%).
| Demographics | Rating | Rank | Vision Disability |
| Belgians | 75.9 /100 | #150 | Good 2.1% |
| Immigrants | Norway | 75.5 /100 | #151 | Good 2.1% |
| Immigrants | Southern Europe | 74.6 /100 | #152 | Good 2.1% |
| Immigrants | South America | 73.8 /100 | #153 | Good 2.1% |
| Slovenes | 73.6 /100 | #154 | Good 2.1% |
| Immigrants | Colombia | 72.1 /100 | #155 | Good 2.1% |
| Pakistanis | 71.6 /100 | #156 | Good 2.1% |
| Serbians | 70.2 /100 | #157 | Good 2.1% |
| Immigrants | Uzbekistan | 69.9 /100 | #158 | Good 2.1% |
| South Africans | 69.8 /100 | #159 | Good 2.1% |
| Austrians | 69.0 /100 | #160 | Good 2.1% |
| Iraqis | 67.7 /100 | #161 | Good 2.1% |
| Hungarians | 67.4 /100 | #162 | Good 2.1% |
| Icelanders | 66.1 /100 | #163 | Good 2.1% |
| Immigrants | Bangladesh | 65.5 /100 | #164 | Good 2.1% |
Demographics Similar to Cypriots by Vision Disability
In terms of vision disability, the demographic groups most similar to Cypriots are Immigrants from Ireland (2.0%, a difference of 0.030%), Immigrants from Ethiopia (2.0%, a difference of 0.16%), Zimbabwean (2.0%, a difference of 0.22%), Eastern European (2.0%, a difference of 0.22%), and Immigrants from Indonesia (2.0%, a difference of 0.24%).
| Demographics | Rating | Rank | Vision Disability |
| Immigrants | Turkey | 99.8 /100 | #34 | Exceptional 1.9% |
| Immigrants | Australia | 99.8 /100 | #35 | Exceptional 1.9% |
| Cambodians | 99.8 /100 | #36 | Exceptional 2.0% |
| Bhutanese | 99.8 /100 | #37 | Exceptional 2.0% |
| Immigrants | Kuwait | 99.8 /100 | #38 | Exceptional 2.0% |
| Zimbabweans | 99.7 /100 | #39 | Exceptional 2.0% |
| Immigrants | Ireland | 99.7 /100 | #40 | Exceptional 2.0% |
| Cypriots | 99.7 /100 | #41 | Exceptional 2.0% |
| Immigrants | Ethiopia | 99.7 /100 | #42 | Exceptional 2.0% |
| Eastern Europeans | 99.7 /100 | #43 | Exceptional 2.0% |
| Immigrants | Indonesia | 99.7 /100 | #44 | Exceptional 2.0% |
| Ethiopians | 99.7 /100 | #45 | Exceptional 2.0% |
| Immigrants | Sweden | 99.7 /100 | #46 | Exceptional 2.0% |
| Immigrants | Bulgaria | 99.7 /100 | #47 | Exceptional 2.0% |
| Israelis | 99.6 /100 | #48 | Exceptional 2.0% |