Senegalese vs Immigrants from Czechoslovakia Female Disability
COMPARE
Senegalese
Immigrants from Czechoslovakia
Female Disability
Female Disability Comparison
Senegalese
Immigrants from Czechoslovakia
12.8%
FEMALE DISABILITY
0.4/ 100
METRIC RATING
267th/ 347
METRIC RANK
11.6%
FEMALE DISABILITY
99.5/ 100
METRIC RATING
92nd/ 347
METRIC RANK
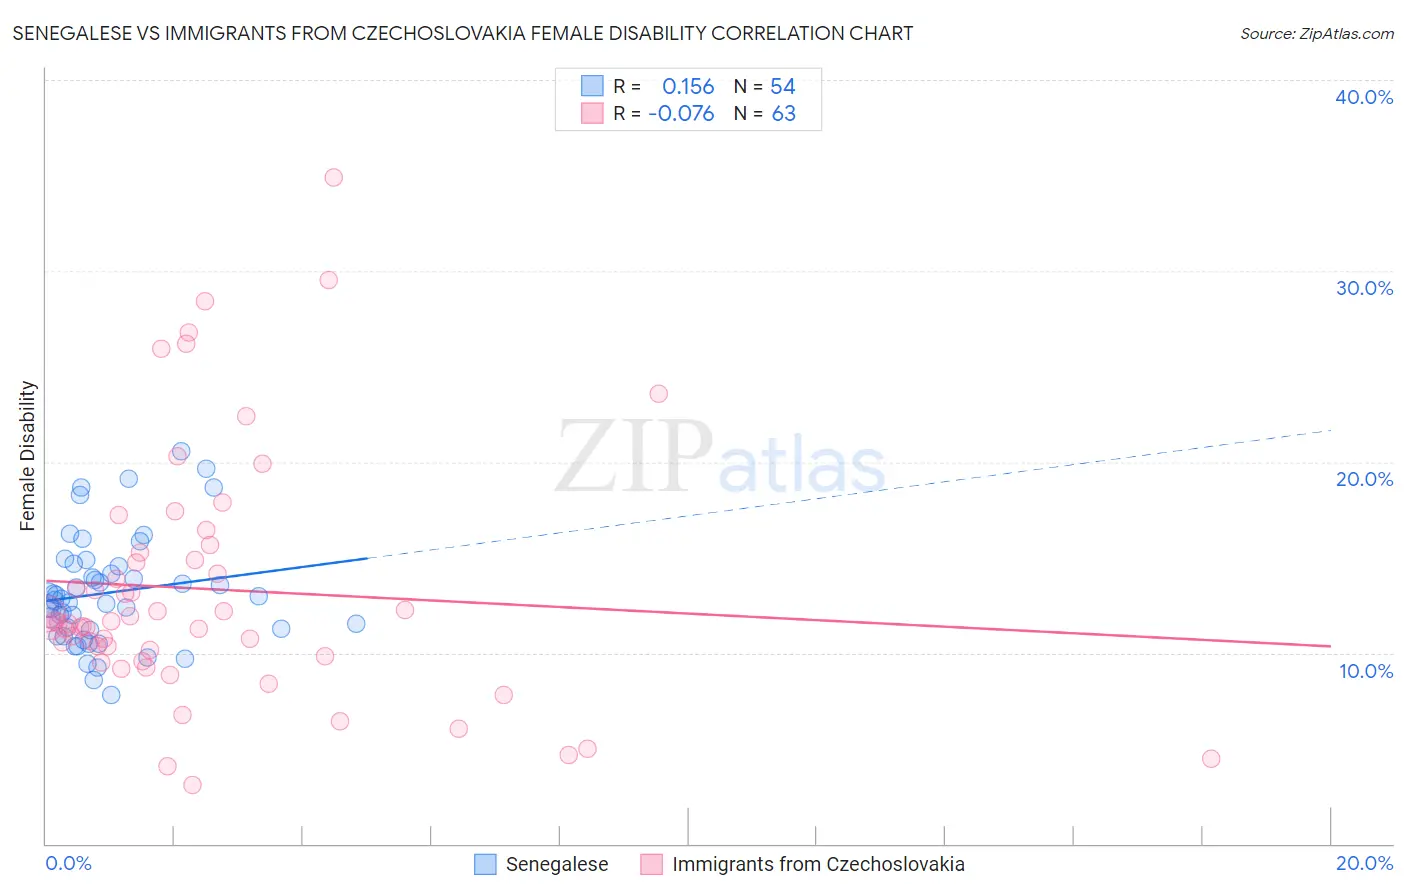
Senegalese vs Immigrants from Czechoslovakia Female Disability Correlation Chart
The statistical analysis conducted on geographies consisting of 78,142,569 people shows a poor positive correlation between the proportion of Senegalese and percentage of females with a disability in the United States with a correlation coefficient (R) of 0.156 and weighted average of 12.8%. Similarly, the statistical analysis conducted on geographies consisting of 195,453,586 people shows a slight negative correlation between the proportion of Immigrants from Czechoslovakia and percentage of females with a disability in the United States with a correlation coefficient (R) of -0.076 and weighted average of 11.6%, a difference of 10.6%.
Female Disability Correlation Summary
| Measurement | Senegalese | Immigrants from Czechoslovakia |
| Minimum | 7.8% | 3.1% |
| Maximum | 20.6% | 34.9% |
| Range | 12.7% | 31.8% |
| Mean | 13.2% | 13.3% |
| Median | 12.8% | 11.6% |
| Interquartile 25% (IQ1) | 11.2% | 9.8% |
| Interquartile 75% (IQ3) | 14.5% | 15.3% |
| Interquartile Range (IQR) | 3.4% | 5.5% |
| Standard Deviation (Sample) | 2.9% | 6.5% |
| Standard Deviation (Population) | 2.9% | 6.5% |
Similar Demographics by Female Disability
Demographics Similar to Senegalese by Female Disability
In terms of female disability, the demographic groups most similar to Senegalese are Finnish (12.8%, a difference of 0.020%), Immigrants from Laos (12.8%, a difference of 0.030%), Indonesian (12.8%, a difference of 0.090%), West Indian (12.8%, a difference of 0.13%), and Immigrants from Liberia (12.9%, a difference of 0.27%).
| Demographics | Rating | Rank | Female Disability |
| Sub-Saharan Africans | 1.0 /100 | #260 | Tragic 12.7% |
| Bermudans | 1.0 /100 | #261 | Tragic 12.7% |
| Czechoslovakians | 0.9 /100 | #262 | Tragic 12.7% |
| Spaniards | 0.7 /100 | #263 | Tragic 12.8% |
| Alaska Natives | 0.6 /100 | #264 | Tragic 12.8% |
| West Indians | 0.5 /100 | #265 | Tragic 12.8% |
| Finns | 0.4 /100 | #266 | Tragic 12.8% |
| Senegalese | 0.4 /100 | #267 | Tragic 12.8% |
| Immigrants | Laos | 0.4 /100 | #268 | Tragic 12.8% |
| Indonesians | 0.4 /100 | #269 | Tragic 12.8% |
| Immigrants | Liberia | 0.3 /100 | #270 | Tragic 12.9% |
| Dutch | 0.2 /100 | #271 | Tragic 12.9% |
| Germans | 0.1 /100 | #272 | Tragic 12.9% |
| Sioux | 0.1 /100 | #273 | Tragic 12.9% |
| Portuguese | 0.1 /100 | #274 | Tragic 13.0% |
Demographics Similar to Immigrants from Czechoslovakia by Female Disability
In terms of female disability, the demographic groups most similar to Immigrants from Czechoslovakia are Immigrants from Romania (11.6%, a difference of 0.010%), Immigrants from Zimbabwe (11.6%, a difference of 0.010%), Vietnamese (11.6%, a difference of 0.020%), Immigrants from Sierra Leone (11.6%, a difference of 0.10%), and Immigrants from Denmark (11.6%, a difference of 0.12%).
| Demographics | Rating | Rank | Female Disability |
| Palestinians | 99.6 /100 | #85 | Exceptional 11.6% |
| Immigrants | Cameroon | 99.6 /100 | #86 | Exceptional 11.6% |
| Immigrants | Denmark | 99.5 /100 | #87 | Exceptional 11.6% |
| Yup'ik | 99.5 /100 | #88 | Exceptional 11.6% |
| Vietnamese | 99.5 /100 | #89 | Exceptional 11.6% |
| Immigrants | Romania | 99.5 /100 | #90 | Exceptional 11.6% |
| Immigrants | Zimbabwe | 99.5 /100 | #91 | Exceptional 11.6% |
| Immigrants | Czechoslovakia | 99.5 /100 | #92 | Exceptional 11.6% |
| Immigrants | Sierra Leone | 99.4 /100 | #93 | Exceptional 11.6% |
| Immigrants | Brazil | 99.4 /100 | #94 | Exceptional 11.6% |
| Immigrants | Northern Europe | 99.4 /100 | #95 | Exceptional 11.6% |
| Immigrants | Russia | 99.0 /100 | #96 | Exceptional 11.7% |
| Koreans | 99.0 /100 | #97 | Exceptional 11.7% |
| Uruguayans | 98.8 /100 | #98 | Exceptional 11.7% |
| Immigrants | Philippines | 98.6 /100 | #99 | Exceptional 11.7% |