Senegalese vs Cheyenne Female Disability
COMPARE
Senegalese
Cheyenne
Female Disability
Female Disability Comparison
Senegalese
Cheyenne
12.8%
FEMALE DISABILITY
0.4/ 100
METRIC RATING
267th/ 347
METRIC RANK
13.0%
FEMALE DISABILITY
0.1/ 100
METRIC RATING
275th/ 347
METRIC RANK
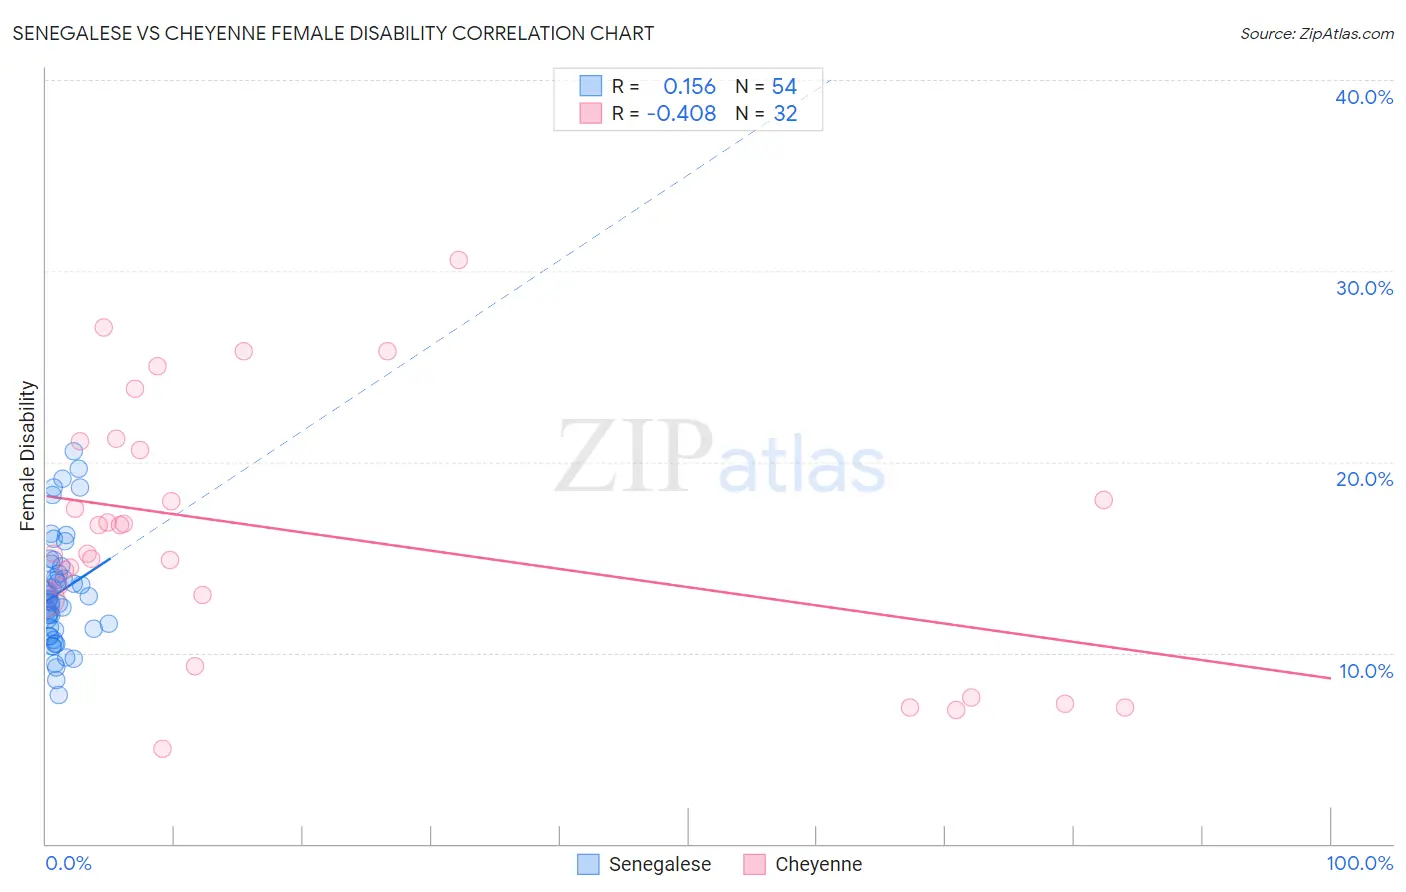
Senegalese vs Cheyenne Female Disability Correlation Chart
The statistical analysis conducted on geographies consisting of 78,142,569 people shows a poor positive correlation between the proportion of Senegalese and percentage of females with a disability in the United States with a correlation coefficient (R) of 0.156 and weighted average of 12.8%. Similarly, the statistical analysis conducted on geographies consisting of 80,710,076 people shows a moderate negative correlation between the proportion of Cheyenne and percentage of females with a disability in the United States with a correlation coefficient (R) of -0.408 and weighted average of 13.0%, a difference of 1.2%.
Female Disability Correlation Summary
| Measurement | Senegalese | Cheyenne |
| Minimum | 7.8% | 5.0% |
| Maximum | 20.6% | 30.6% |
| Range | 12.7% | 25.6% |
| Mean | 13.2% | 16.3% |
| Median | 12.8% | 16.0% |
| Interquartile 25% (IQ1) | 11.2% | 12.9% |
| Interquartile 75% (IQ3) | 14.5% | 20.9% |
| Interquartile Range (IQR) | 3.4% | 7.9% |
| Standard Deviation (Sample) | 2.9% | 6.6% |
| Standard Deviation (Population) | 2.9% | 6.5% |
Demographics Similar to Senegalese and Cheyenne by Female Disability
In terms of female disability, the demographic groups most similar to Senegalese are Finnish (12.8%, a difference of 0.020%), Immigrants from Laos (12.8%, a difference of 0.030%), Indonesian (12.8%, a difference of 0.090%), West Indian (12.8%, a difference of 0.13%), and Immigrants from Liberia (12.9%, a difference of 0.27%). Similarly, the demographic groups most similar to Cheyenne are Portuguese (13.0%, a difference of 0.050%), Immigrants from Dominica (13.0%, a difference of 0.050%), Sioux (12.9%, a difference of 0.17%), German (12.9%, a difference of 0.19%), and Spanish (13.0%, a difference of 0.25%).
| Demographics | Rating | Rank | Female Disability |
| Bermudans | 1.0 /100 | #261 | Tragic 12.7% |
| Czechoslovakians | 0.9 /100 | #262 | Tragic 12.7% |
| Spaniards | 0.7 /100 | #263 | Tragic 12.8% |
| Alaska Natives | 0.6 /100 | #264 | Tragic 12.8% |
| West Indians | 0.5 /100 | #265 | Tragic 12.8% |
| Finns | 0.4 /100 | #266 | Tragic 12.8% |
| Senegalese | 0.4 /100 | #267 | Tragic 12.8% |
| Immigrants | Laos | 0.4 /100 | #268 | Tragic 12.8% |
| Indonesians | 0.4 /100 | #269 | Tragic 12.8% |
| Immigrants | Liberia | 0.3 /100 | #270 | Tragic 12.9% |
| Dutch | 0.2 /100 | #271 | Tragic 12.9% |
| Germans | 0.1 /100 | #272 | Tragic 12.9% |
| Sioux | 0.1 /100 | #273 | Tragic 12.9% |
| Portuguese | 0.1 /100 | #274 | Tragic 13.0% |
| Cheyenne | 0.1 /100 | #275 | Tragic 13.0% |
| Immigrants | Dominica | 0.1 /100 | #276 | Tragic 13.0% |
| Spanish | 0.1 /100 | #277 | Tragic 13.0% |
| Scottish | 0.1 /100 | #278 | Tragic 13.0% |
| Arapaho | 0.1 /100 | #279 | Tragic 13.0% |
| Irish | 0.1 /100 | #280 | Tragic 13.1% |
| U.S. Virgin Islanders | 0.1 /100 | #281 | Tragic 13.1% |