Senegalese vs Danish Female Disability
COMPARE
Senegalese
Danish
Female Disability
Female Disability Comparison
Senegalese
Danes
12.8%
FEMALE DISABILITY
0.4/ 100
METRIC RATING
267th/ 347
METRIC RANK
12.1%
FEMALE DISABILITY
72.5/ 100
METRIC RATING
157th/ 347
METRIC RANK
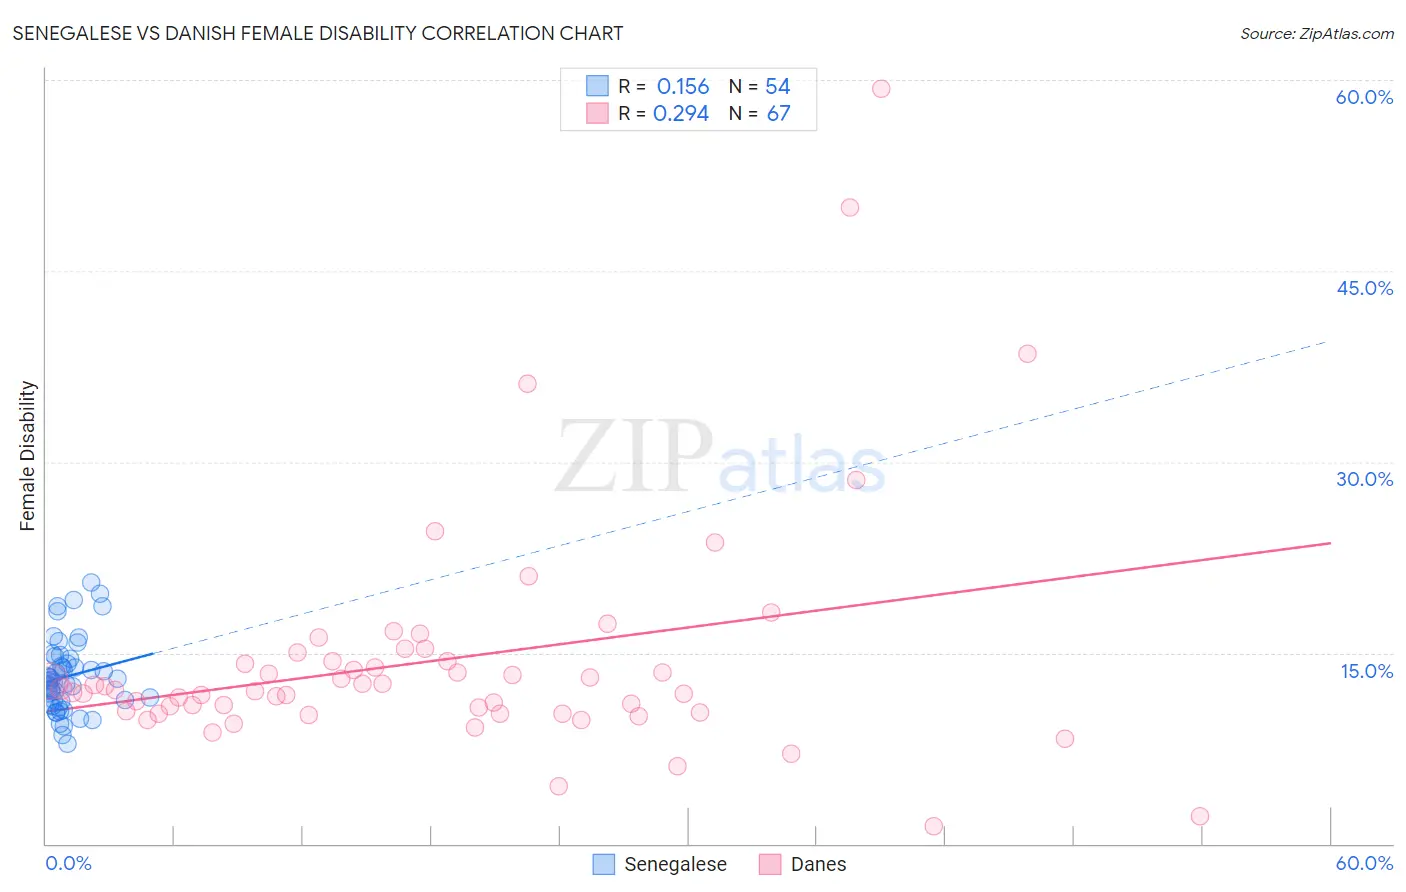
Senegalese vs Danish Female Disability Correlation Chart
The statistical analysis conducted on geographies consisting of 78,142,569 people shows a poor positive correlation between the proportion of Senegalese and percentage of females with a disability in the United States with a correlation coefficient (R) of 0.156 and weighted average of 12.8%. Similarly, the statistical analysis conducted on geographies consisting of 474,084,483 people shows a weak positive correlation between the proportion of Danes and percentage of females with a disability in the United States with a correlation coefficient (R) of 0.294 and weighted average of 12.1%, a difference of 6.1%.
Female Disability Correlation Summary
| Measurement | Senegalese | Danish |
| Minimum | 7.8% | 1.4% |
| Maximum | 20.6% | 59.3% |
| Range | 12.7% | 58.0% |
| Mean | 13.2% | 14.4% |
| Median | 12.8% | 12.1% |
| Interquartile 25% (IQ1) | 11.2% | 10.3% |
| Interquartile 75% (IQ3) | 14.5% | 14.3% |
| Interquartile Range (IQR) | 3.4% | 4.0% |
| Standard Deviation (Sample) | 2.9% | 9.4% |
| Standard Deviation (Population) | 2.9% | 9.3% |
Similar Demographics by Female Disability
Demographics Similar to Senegalese by Female Disability
In terms of female disability, the demographic groups most similar to Senegalese are Finnish (12.8%, a difference of 0.020%), Immigrants from Laos (12.8%, a difference of 0.030%), Indonesian (12.8%, a difference of 0.090%), West Indian (12.8%, a difference of 0.13%), and Immigrants from Liberia (12.9%, a difference of 0.27%).
| Demographics | Rating | Rank | Female Disability |
| Sub-Saharan Africans | 1.0 /100 | #260 | Tragic 12.7% |
| Bermudans | 1.0 /100 | #261 | Tragic 12.7% |
| Czechoslovakians | 0.9 /100 | #262 | Tragic 12.7% |
| Spaniards | 0.7 /100 | #263 | Tragic 12.8% |
| Alaska Natives | 0.6 /100 | #264 | Tragic 12.8% |
| West Indians | 0.5 /100 | #265 | Tragic 12.8% |
| Finns | 0.4 /100 | #266 | Tragic 12.8% |
| Senegalese | 0.4 /100 | #267 | Tragic 12.8% |
| Immigrants | Laos | 0.4 /100 | #268 | Tragic 12.8% |
| Indonesians | 0.4 /100 | #269 | Tragic 12.8% |
| Immigrants | Liberia | 0.3 /100 | #270 | Tragic 12.9% |
| Dutch | 0.2 /100 | #271 | Tragic 12.9% |
| Germans | 0.1 /100 | #272 | Tragic 12.9% |
| Sioux | 0.1 /100 | #273 | Tragic 12.9% |
| Portuguese | 0.1 /100 | #274 | Tragic 13.0% |
Demographics Similar to Danes by Female Disability
In terms of female disability, the demographic groups most similar to Danes are Immigrants from Middle Africa (12.1%, a difference of 0.010%), Moroccan (12.1%, a difference of 0.020%), Ghanaian (12.1%, a difference of 0.20%), Syrian (12.1%, a difference of 0.22%), and Immigrants from Central America (12.1%, a difference of 0.22%).
| Demographics | Rating | Rank | Female Disability |
| Immigrants | Moldova | 81.4 /100 | #150 | Excellent 12.0% |
| Icelanders | 80.7 /100 | #151 | Excellent 12.0% |
| Immigrants | Scotland | 79.3 /100 | #152 | Good 12.0% |
| Sudanese | 79.1 /100 | #153 | Good 12.0% |
| Syrians | 76.9 /100 | #154 | Good 12.1% |
| Ghanaians | 76.6 /100 | #155 | Good 12.1% |
| Moroccans | 72.9 /100 | #156 | Good 12.1% |
| Danes | 72.5 /100 | #157 | Good 12.1% |
| Immigrants | Middle Africa | 72.4 /100 | #158 | Good 12.1% |
| Immigrants | Central America | 67.7 /100 | #159 | Good 12.1% |
| Immigrants | Guatemala | 66.0 /100 | #160 | Good 12.1% |
| Guyanese | 64.7 /100 | #161 | Good 12.1% |
| Immigrants | Ukraine | 64.3 /100 | #162 | Good 12.1% |
| Guatemalans | 63.8 /100 | #163 | Good 12.1% |
| Czechs | 63.6 /100 | #164 | Good 12.1% |