Senegalese vs Ugandan Female Disability
COMPARE
Senegalese
Ugandan
Female Disability
Female Disability Comparison
Senegalese
Ugandans
12.8%
FEMALE DISABILITY
0.4/ 100
METRIC RATING
267th/ 347
METRIC RANK
11.9%
FEMALE DISABILITY
94.0/ 100
METRIC RATING
136th/ 347
METRIC RANK
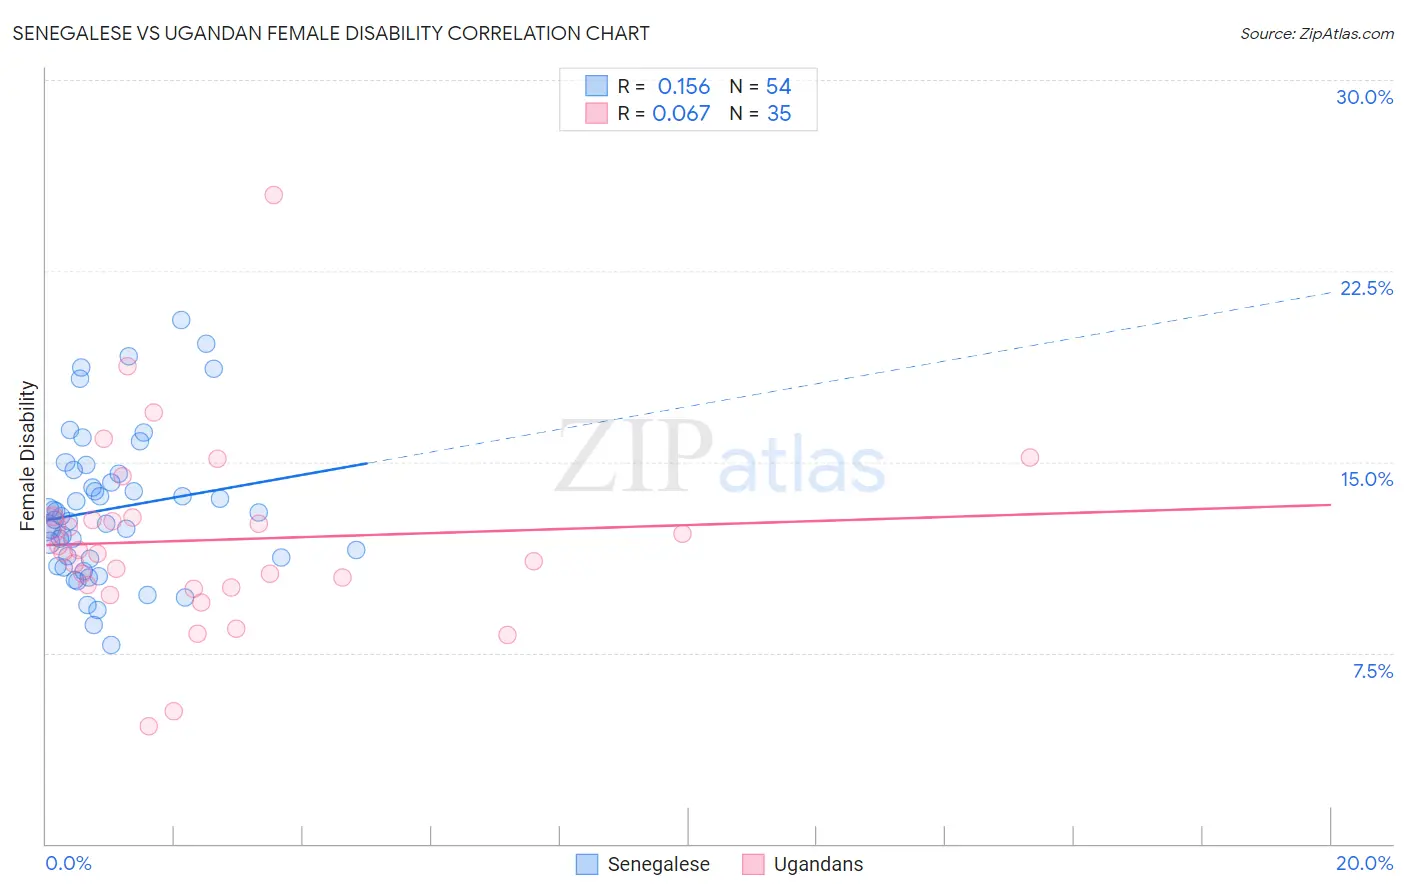
Senegalese vs Ugandan Female Disability Correlation Chart
The statistical analysis conducted on geographies consisting of 78,142,569 people shows a poor positive correlation between the proportion of Senegalese and percentage of females with a disability in the United States with a correlation coefficient (R) of 0.156 and weighted average of 12.8%. Similarly, the statistical analysis conducted on geographies consisting of 94,017,186 people shows a slight positive correlation between the proportion of Ugandans and percentage of females with a disability in the United States with a correlation coefficient (R) of 0.067 and weighted average of 11.9%, a difference of 7.9%.
Female Disability Correlation Summary
| Measurement | Senegalese | Ugandan |
| Minimum | 7.8% | 4.6% |
| Maximum | 20.6% | 25.5% |
| Range | 12.7% | 20.8% |
| Mean | 13.2% | 11.9% |
| Median | 12.8% | 11.5% |
| Interquartile 25% (IQ1) | 11.2% | 10.1% |
| Interquartile 75% (IQ3) | 14.5% | 12.8% |
| Interquartile Range (IQR) | 3.4% | 2.8% |
| Standard Deviation (Sample) | 2.9% | 3.7% |
| Standard Deviation (Population) | 2.9% | 3.7% |
Similar Demographics by Female Disability
Demographics Similar to Senegalese by Female Disability
In terms of female disability, the demographic groups most similar to Senegalese are Finnish (12.8%, a difference of 0.020%), Immigrants from Laos (12.8%, a difference of 0.030%), Indonesian (12.8%, a difference of 0.090%), West Indian (12.8%, a difference of 0.13%), and Immigrants from Liberia (12.9%, a difference of 0.27%).
| Demographics | Rating | Rank | Female Disability |
| Sub-Saharan Africans | 1.0 /100 | #260 | Tragic 12.7% |
| Bermudans | 1.0 /100 | #261 | Tragic 12.7% |
| Czechoslovakians | 0.9 /100 | #262 | Tragic 12.7% |
| Spaniards | 0.7 /100 | #263 | Tragic 12.8% |
| Alaska Natives | 0.6 /100 | #264 | Tragic 12.8% |
| West Indians | 0.5 /100 | #265 | Tragic 12.8% |
| Finns | 0.4 /100 | #266 | Tragic 12.8% |
| Senegalese | 0.4 /100 | #267 | Tragic 12.8% |
| Immigrants | Laos | 0.4 /100 | #268 | Tragic 12.8% |
| Indonesians | 0.4 /100 | #269 | Tragic 12.8% |
| Immigrants | Liberia | 0.3 /100 | #270 | Tragic 12.9% |
| Dutch | 0.2 /100 | #271 | Tragic 12.9% |
| Germans | 0.1 /100 | #272 | Tragic 12.9% |
| Sioux | 0.1 /100 | #273 | Tragic 12.9% |
| Portuguese | 0.1 /100 | #274 | Tragic 13.0% |
Demographics Similar to Ugandans by Female Disability
In terms of female disability, the demographic groups most similar to Ugandans are Central American (11.9%, a difference of 0.030%), Immigrants from Norway (11.9%, a difference of 0.040%), Kenyan (11.9%, a difference of 0.090%), Immigrants from Nicaragua (11.9%, a difference of 0.090%), and Immigrants from Syria (11.9%, a difference of 0.10%).
| Demographics | Rating | Rank | Female Disability |
| Macedonians | 95.5 /100 | #129 | Exceptional 11.8% |
| Nicaraguans | 95.2 /100 | #130 | Exceptional 11.9% |
| Arabs | 95.1 /100 | #131 | Exceptional 11.9% |
| Immigrants | Syria | 94.6 /100 | #132 | Exceptional 11.9% |
| Kenyans | 94.5 /100 | #133 | Exceptional 11.9% |
| Immigrants | Nicaragua | 94.5 /100 | #134 | Exceptional 11.9% |
| Central Americans | 94.2 /100 | #135 | Exceptional 11.9% |
| Ugandans | 94.0 /100 | #136 | Exceptional 11.9% |
| Immigrants | Norway | 93.8 /100 | #137 | Exceptional 11.9% |
| Ecuadorians | 93.4 /100 | #138 | Exceptional 11.9% |
| Immigrants | Hungary | 92.8 /100 | #139 | Exceptional 11.9% |
| Romanians | 91.6 /100 | #140 | Exceptional 11.9% |
| Immigrants | Ecuador | 91.5 /100 | #141 | Exceptional 11.9% |
| Immigrants | Africa | 90.0 /100 | #142 | Excellent 11.9% |
| Immigrants | Sudan | 89.6 /100 | #143 | Excellent 11.9% |