Cypriot vs Immigrants from Czechoslovakia Female Disability
COMPARE
Cypriot
Immigrants from Czechoslovakia
Female Disability
Female Disability Comparison
Cypriots
Immigrants from Czechoslovakia
11.2%
FEMALE DISABILITY
100.0/ 100
METRIC RATING
36th/ 347
METRIC RANK
11.6%
FEMALE DISABILITY
99.5/ 100
METRIC RATING
92nd/ 347
METRIC RANK
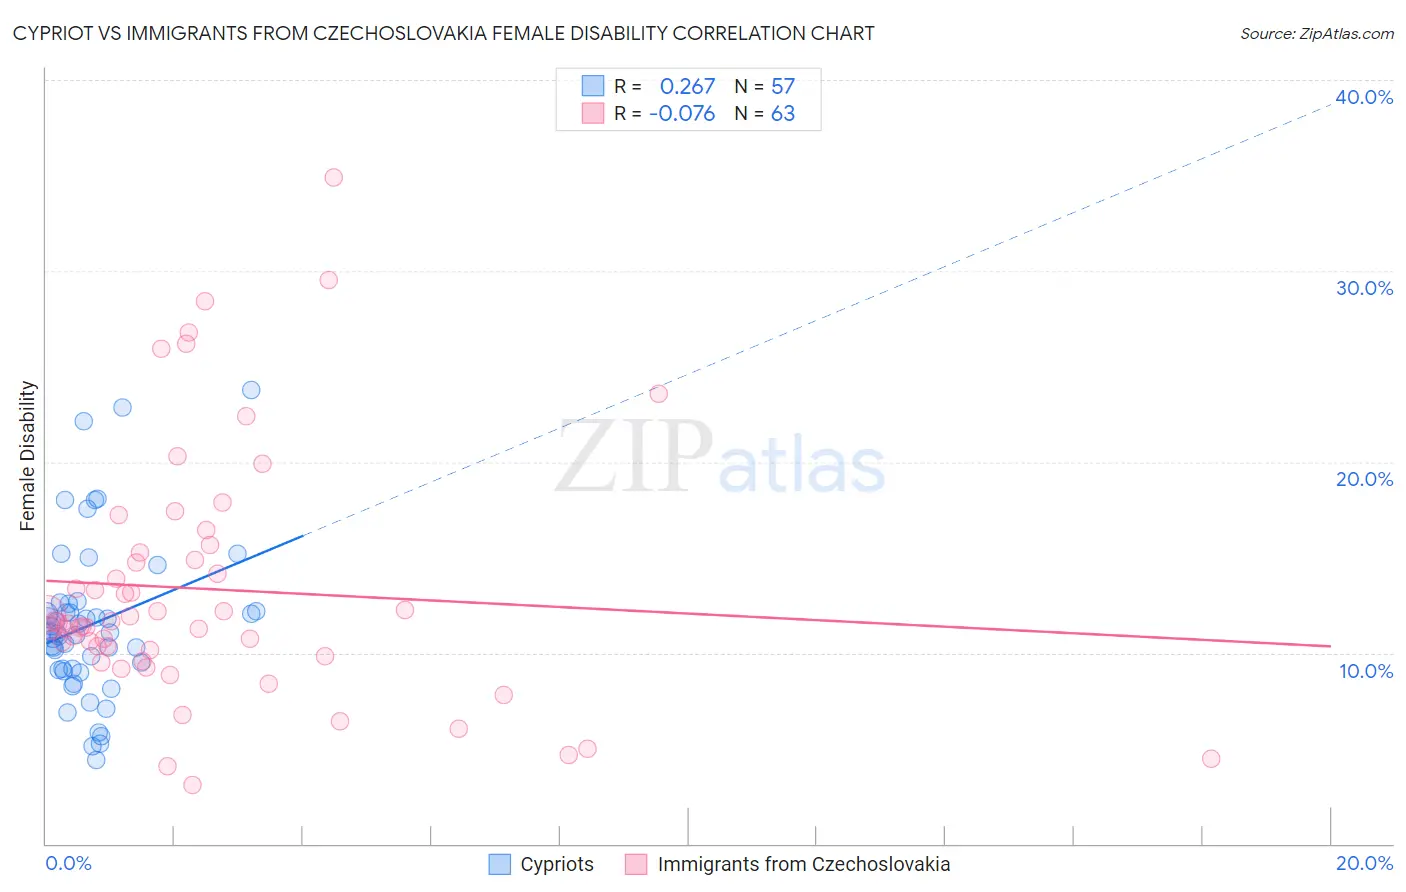
Cypriot vs Immigrants from Czechoslovakia Female Disability Correlation Chart
The statistical analysis conducted on geographies consisting of 61,870,589 people shows a weak positive correlation between the proportion of Cypriots and percentage of females with a disability in the United States with a correlation coefficient (R) of 0.267 and weighted average of 11.2%. Similarly, the statistical analysis conducted on geographies consisting of 195,453,586 people shows a slight negative correlation between the proportion of Immigrants from Czechoslovakia and percentage of females with a disability in the United States with a correlation coefficient (R) of -0.076 and weighted average of 11.6%, a difference of 3.6%.
Female Disability Correlation Summary
| Measurement | Cypriot | Immigrants from Czechoslovakia |
| Minimum | 4.4% | 3.1% |
| Maximum | 23.8% | 34.9% |
| Range | 19.4% | 31.8% |
| Mean | 11.5% | 13.3% |
| Median | 11.1% | 11.6% |
| Interquartile 25% (IQ1) | 9.1% | 9.8% |
| Interquartile 75% (IQ3) | 12.4% | 15.3% |
| Interquartile Range (IQR) | 3.3% | 5.5% |
| Standard Deviation (Sample) | 4.1% | 6.5% |
| Standard Deviation (Population) | 4.1% | 6.5% |
Similar Demographics by Female Disability
Demographics Similar to Cypriots by Female Disability
In terms of female disability, the demographic groups most similar to Cypriots are Ethiopian (11.2%, a difference of 0.010%), Immigrants from Ethiopia (11.2%, a difference of 0.040%), Immigrants from Japan (11.2%, a difference of 0.070%), Immigrants from Indonesia (11.2%, a difference of 0.21%), and Immigrants from Lithuania (11.2%, a difference of 0.25%).
| Demographics | Rating | Rank | Female Disability |
| Immigrants | Malaysia | 100.0 /100 | #29 | Exceptional 11.1% |
| Turks | 100.0 /100 | #30 | Exceptional 11.1% |
| Immigrants | Kuwait | 100.0 /100 | #31 | Exceptional 11.1% |
| Immigrants | Australia | 100.0 /100 | #32 | Exceptional 11.1% |
| Immigrants | Egypt | 100.0 /100 | #33 | Exceptional 11.1% |
| Immigrants | Indonesia | 100.0 /100 | #34 | Exceptional 11.2% |
| Immigrants | Japan | 100.0 /100 | #35 | Exceptional 11.2% |
| Cypriots | 100.0 /100 | #36 | Exceptional 11.2% |
| Ethiopians | 100.0 /100 | #37 | Exceptional 11.2% |
| Immigrants | Ethiopia | 100.0 /100 | #38 | Exceptional 11.2% |
| Immigrants | Lithuania | 100.0 /100 | #39 | Exceptional 11.2% |
| Mongolians | 100.0 /100 | #40 | Exceptional 11.2% |
| Paraguayans | 100.0 /100 | #41 | Exceptional 11.2% |
| Israelis | 100.0 /100 | #42 | Exceptional 11.2% |
| Afghans | 100.0 /100 | #43 | Exceptional 11.2% |
Demographics Similar to Immigrants from Czechoslovakia by Female Disability
In terms of female disability, the demographic groups most similar to Immigrants from Czechoslovakia are Immigrants from Romania (11.6%, a difference of 0.010%), Immigrants from Zimbabwe (11.6%, a difference of 0.010%), Vietnamese (11.6%, a difference of 0.020%), Immigrants from Sierra Leone (11.6%, a difference of 0.10%), and Immigrants from Denmark (11.6%, a difference of 0.12%).
| Demographics | Rating | Rank | Female Disability |
| Palestinians | 99.6 /100 | #85 | Exceptional 11.6% |
| Immigrants | Cameroon | 99.6 /100 | #86 | Exceptional 11.6% |
| Immigrants | Denmark | 99.5 /100 | #87 | Exceptional 11.6% |
| Yup'ik | 99.5 /100 | #88 | Exceptional 11.6% |
| Vietnamese | 99.5 /100 | #89 | Exceptional 11.6% |
| Immigrants | Romania | 99.5 /100 | #90 | Exceptional 11.6% |
| Immigrants | Zimbabwe | 99.5 /100 | #91 | Exceptional 11.6% |
| Immigrants | Czechoslovakia | 99.5 /100 | #92 | Exceptional 11.6% |
| Immigrants | Sierra Leone | 99.4 /100 | #93 | Exceptional 11.6% |
| Immigrants | Brazil | 99.4 /100 | #94 | Exceptional 11.6% |
| Immigrants | Northern Europe | 99.4 /100 | #95 | Exceptional 11.6% |
| Immigrants | Russia | 99.0 /100 | #96 | Exceptional 11.7% |
| Koreans | 99.0 /100 | #97 | Exceptional 11.7% |
| Uruguayans | 98.8 /100 | #98 | Exceptional 11.7% |
| Immigrants | Philippines | 98.6 /100 | #99 | Exceptional 11.7% |