Immigrants from Bulgaria vs Immigrants from Czechoslovakia Female Disability
COMPARE
Immigrants from Bulgaria
Immigrants from Czechoslovakia
Female Disability
Female Disability Comparison
Immigrants from Bulgaria
Immigrants from Czechoslovakia
11.4%
FEMALE DISABILITY
99.9/ 100
METRIC RATING
60th/ 347
METRIC RANK
11.6%
FEMALE DISABILITY
99.5/ 100
METRIC RATING
92nd/ 347
METRIC RANK
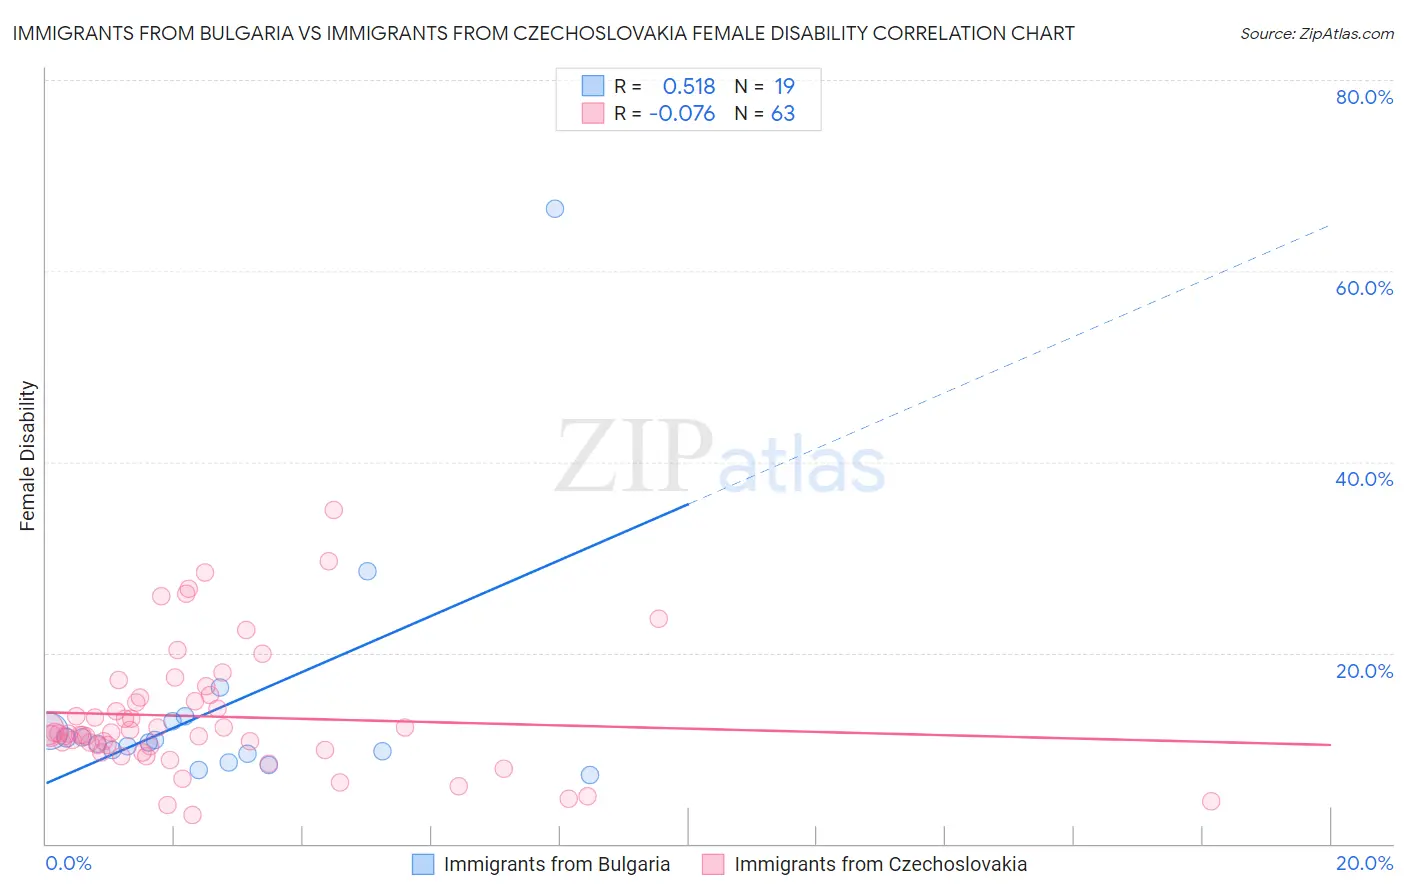
Immigrants from Bulgaria vs Immigrants from Czechoslovakia Female Disability Correlation Chart
The statistical analysis conducted on geographies consisting of 172,548,429 people shows a substantial positive correlation between the proportion of Immigrants from Bulgaria and percentage of females with a disability in the United States with a correlation coefficient (R) of 0.518 and weighted average of 11.4%. Similarly, the statistical analysis conducted on geographies consisting of 195,453,586 people shows a slight negative correlation between the proportion of Immigrants from Czechoslovakia and percentage of females with a disability in the United States with a correlation coefficient (R) of -0.076 and weighted average of 11.6%, a difference of 1.7%.
Female Disability Correlation Summary
| Measurement | Immigrants from Bulgaria | Immigrants from Czechoslovakia |
| Minimum | 7.2% | 3.1% |
| Maximum | 66.5% | 34.9% |
| Range | 59.3% | 31.8% |
| Mean | 14.4% | 13.3% |
| Median | 10.7% | 11.6% |
| Interquartile 25% (IQ1) | 9.4% | 9.8% |
| Interquartile 75% (IQ3) | 12.9% | 15.3% |
| Interquartile Range (IQR) | 3.5% | 5.5% |
| Standard Deviation (Sample) | 13.4% | 6.5% |
| Standard Deviation (Population) | 13.1% | 6.5% |
Similar Demographics by Female Disability
Demographics Similar to Immigrants from Bulgaria by Female Disability
In terms of female disability, the demographic groups most similar to Immigrants from Bulgaria are Immigrants from France (11.4%, a difference of 0.060%), Immigrants from Spain (11.4%, a difference of 0.11%), Sri Lankan (11.4%, a difference of 0.15%), Laotian (11.4%, a difference of 0.25%), and Immigrants from Colombia (11.4%, a difference of 0.26%).
| Demographics | Rating | Rank | Female Disability |
| Immigrants | Saudi Arabia | 99.9 /100 | #53 | Exceptional 11.3% |
| Peruvians | 99.9 /100 | #54 | Exceptional 11.3% |
| Bulgarians | 99.9 /100 | #55 | Exceptional 11.3% |
| Taiwanese | 99.9 /100 | #56 | Exceptional 11.4% |
| South Americans | 99.9 /100 | #57 | Exceptional 11.4% |
| Laotians | 99.9 /100 | #58 | Exceptional 11.4% |
| Immigrants | Spain | 99.9 /100 | #59 | Exceptional 11.4% |
| Immigrants | Bulgaria | 99.9 /100 | #60 | Exceptional 11.4% |
| Immigrants | France | 99.9 /100 | #61 | Exceptional 11.4% |
| Sri Lankans | 99.9 /100 | #62 | Exceptional 11.4% |
| Immigrants | Colombia | 99.9 /100 | #63 | Exceptional 11.4% |
| Immigrants | El Salvador | 99.9 /100 | #64 | Exceptional 11.4% |
| Immigrants | South America | 99.9 /100 | #65 | Exceptional 11.4% |
| Salvadorans | 99.8 /100 | #66 | Exceptional 11.5% |
| Immigrants | Vietnam | 99.8 /100 | #67 | Exceptional 11.5% |
Demographics Similar to Immigrants from Czechoslovakia by Female Disability
In terms of female disability, the demographic groups most similar to Immigrants from Czechoslovakia are Immigrants from Romania (11.6%, a difference of 0.010%), Immigrants from Zimbabwe (11.6%, a difference of 0.010%), Vietnamese (11.6%, a difference of 0.020%), Immigrants from Sierra Leone (11.6%, a difference of 0.10%), and Immigrants from Denmark (11.6%, a difference of 0.12%).
| Demographics | Rating | Rank | Female Disability |
| Palestinians | 99.6 /100 | #85 | Exceptional 11.6% |
| Immigrants | Cameroon | 99.6 /100 | #86 | Exceptional 11.6% |
| Immigrants | Denmark | 99.5 /100 | #87 | Exceptional 11.6% |
| Yup'ik | 99.5 /100 | #88 | Exceptional 11.6% |
| Vietnamese | 99.5 /100 | #89 | Exceptional 11.6% |
| Immigrants | Romania | 99.5 /100 | #90 | Exceptional 11.6% |
| Immigrants | Zimbabwe | 99.5 /100 | #91 | Exceptional 11.6% |
| Immigrants | Czechoslovakia | 99.5 /100 | #92 | Exceptional 11.6% |
| Immigrants | Sierra Leone | 99.4 /100 | #93 | Exceptional 11.6% |
| Immigrants | Brazil | 99.4 /100 | #94 | Exceptional 11.6% |
| Immigrants | Northern Europe | 99.4 /100 | #95 | Exceptional 11.6% |
| Immigrants | Russia | 99.0 /100 | #96 | Exceptional 11.7% |
| Koreans | 99.0 /100 | #97 | Exceptional 11.7% |
| Uruguayans | 98.8 /100 | #98 | Exceptional 11.7% |
| Immigrants | Philippines | 98.6 /100 | #99 | Exceptional 11.7% |