Comanche vs Immigrants from Czechoslovakia Female Disability
COMPARE
Comanche
Immigrants from Czechoslovakia
Female Disability
Female Disability Comparison
Comanche
Immigrants from Czechoslovakia
14.2%
FEMALE DISABILITY
0.0/ 100
METRIC RATING
326th/ 347
METRIC RANK
11.6%
FEMALE DISABILITY
99.5/ 100
METRIC RATING
92nd/ 347
METRIC RANK
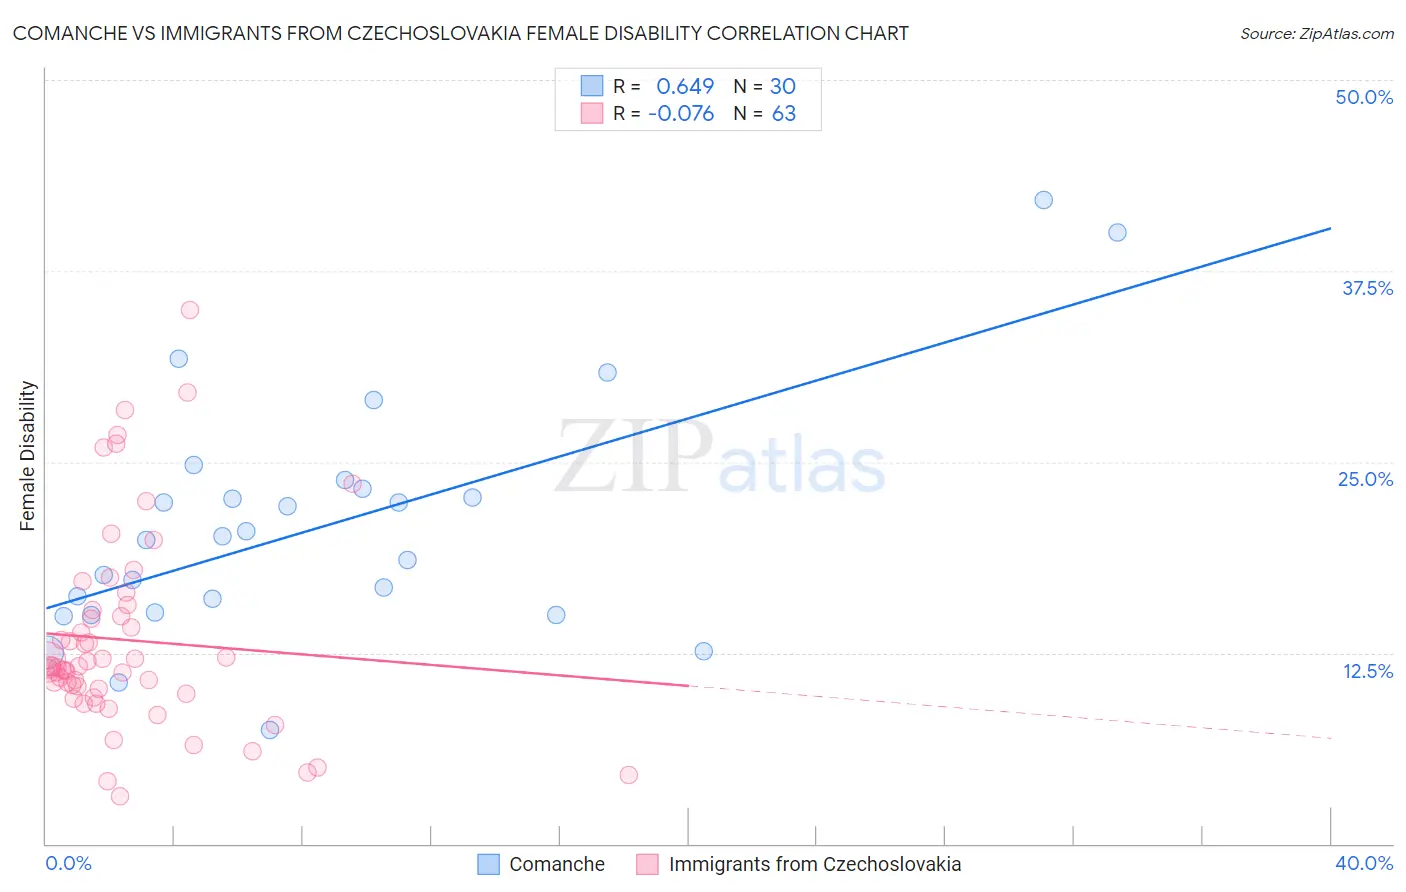
Comanche vs Immigrants from Czechoslovakia Female Disability Correlation Chart
The statistical analysis conducted on geographies consisting of 109,776,573 people shows a significant positive correlation between the proportion of Comanche and percentage of females with a disability in the United States with a correlation coefficient (R) of 0.649 and weighted average of 14.2%. Similarly, the statistical analysis conducted on geographies consisting of 195,453,586 people shows a slight negative correlation between the proportion of Immigrants from Czechoslovakia and percentage of females with a disability in the United States with a correlation coefficient (R) of -0.076 and weighted average of 11.6%, a difference of 22.3%.
Female Disability Correlation Summary
| Measurement | Comanche | Immigrants from Czechoslovakia |
| Minimum | 7.4% | 3.1% |
| Maximum | 42.1% | 34.9% |
| Range | 34.7% | 31.8% |
| Mean | 20.8% | 13.3% |
| Median | 20.0% | 11.6% |
| Interquartile 25% (IQ1) | 15.1% | 9.8% |
| Interquartile 75% (IQ3) | 23.2% | 15.3% |
| Interquartile Range (IQR) | 8.1% | 5.5% |
| Standard Deviation (Sample) | 7.9% | 6.5% |
| Standard Deviation (Population) | 7.7% | 6.5% |
Similar Demographics by Female Disability
Demographics Similar to Comanche by Female Disability
In terms of female disability, the demographic groups most similar to Comanche are Navajo (14.2%, a difference of 0.11%), Native/Alaskan (14.1%, a difference of 0.25%), Black/African American (14.1%, a difference of 0.27%), Pueblo (14.1%, a difference of 0.43%), and Potawatomi (14.1%, a difference of 0.44%).
| Demographics | Rating | Rank | Female Disability |
| Iroquois | 0.0 /100 | #319 | Tragic 14.0% |
| Americans | 0.0 /100 | #320 | Tragic 14.1% |
| Potawatomi | 0.0 /100 | #321 | Tragic 14.1% |
| Pueblo | 0.0 /100 | #322 | Tragic 14.1% |
| Blacks/African Americans | 0.0 /100 | #323 | Tragic 14.1% |
| Natives/Alaskans | 0.0 /100 | #324 | Tragic 14.1% |
| Navajo | 0.0 /100 | #325 | Tragic 14.2% |
| Comanche | 0.0 /100 | #326 | Tragic 14.2% |
| Ottawa | 0.0 /100 | #327 | Tragic 14.2% |
| Cape Verdeans | 0.0 /100 | #328 | Tragic 14.2% |
| Osage | 0.0 /100 | #329 | Tragic 14.3% |
| Yuman | 0.0 /100 | #330 | Tragic 14.5% |
| Immigrants | Cabo Verde | 0.0 /100 | #331 | Tragic 14.6% |
| Pima | 0.0 /100 | #332 | Tragic 14.8% |
| Immigrants | Azores | 0.0 /100 | #333 | Tragic 14.9% |
Demographics Similar to Immigrants from Czechoslovakia by Female Disability
In terms of female disability, the demographic groups most similar to Immigrants from Czechoslovakia are Immigrants from Romania (11.6%, a difference of 0.010%), Immigrants from Zimbabwe (11.6%, a difference of 0.010%), Vietnamese (11.6%, a difference of 0.020%), Immigrants from Sierra Leone (11.6%, a difference of 0.10%), and Immigrants from Denmark (11.6%, a difference of 0.12%).
| Demographics | Rating | Rank | Female Disability |
| Palestinians | 99.6 /100 | #85 | Exceptional 11.6% |
| Immigrants | Cameroon | 99.6 /100 | #86 | Exceptional 11.6% |
| Immigrants | Denmark | 99.5 /100 | #87 | Exceptional 11.6% |
| Yup'ik | 99.5 /100 | #88 | Exceptional 11.6% |
| Vietnamese | 99.5 /100 | #89 | Exceptional 11.6% |
| Immigrants | Romania | 99.5 /100 | #90 | Exceptional 11.6% |
| Immigrants | Zimbabwe | 99.5 /100 | #91 | Exceptional 11.6% |
| Immigrants | Czechoslovakia | 99.5 /100 | #92 | Exceptional 11.6% |
| Immigrants | Sierra Leone | 99.4 /100 | #93 | Exceptional 11.6% |
| Immigrants | Brazil | 99.4 /100 | #94 | Exceptional 11.6% |
| Immigrants | Northern Europe | 99.4 /100 | #95 | Exceptional 11.6% |
| Immigrants | Russia | 99.0 /100 | #96 | Exceptional 11.7% |
| Koreans | 99.0 /100 | #97 | Exceptional 11.7% |
| Uruguayans | 98.8 /100 | #98 | Exceptional 11.7% |
| Immigrants | Philippines | 98.6 /100 | #99 | Exceptional 11.7% |