Belizean vs Macedonian Ambulatory Disability
COMPARE
Belizean
Macedonian
Ambulatory Disability
Ambulatory Disability Comparison
Belizeans
Macedonians
6.5%
AMBULATORY DISABILITY
0.7/ 100
METRIC RATING
254th/ 347
METRIC RANK
6.0%
AMBULATORY DISABILITY
82.8/ 100
METRIC RATING
144th/ 347
METRIC RANK
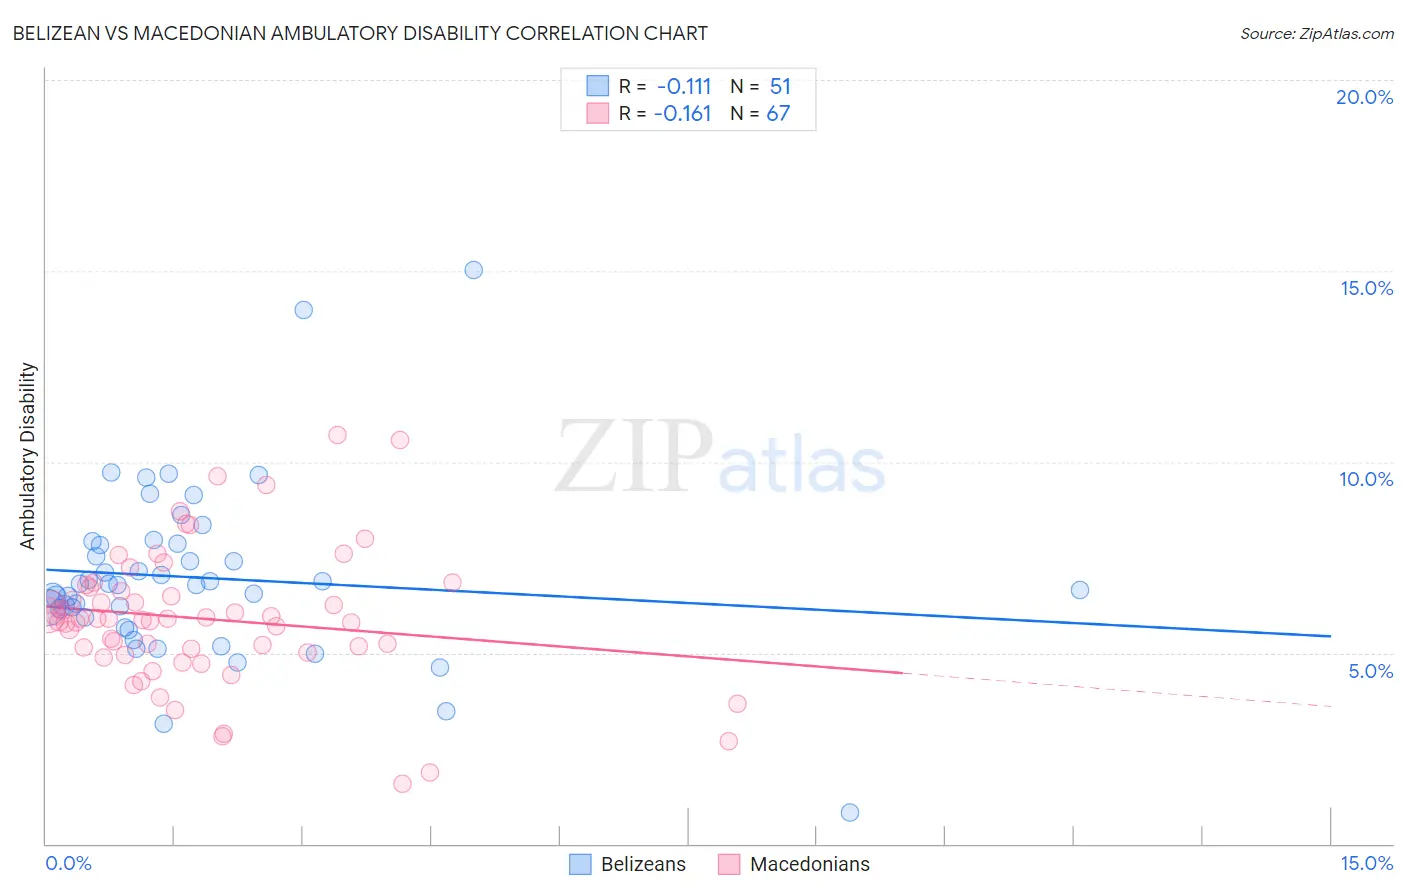
Belizean vs Macedonian Ambulatory Disability Correlation Chart
The statistical analysis conducted on geographies consisting of 144,187,232 people shows a poor negative correlation between the proportion of Belizeans and percentage of population with ambulatory disability in the United States with a correlation coefficient (R) of -0.111 and weighted average of 6.5%. Similarly, the statistical analysis conducted on geographies consisting of 132,658,712 people shows a poor negative correlation between the proportion of Macedonians and percentage of population with ambulatory disability in the United States with a correlation coefficient (R) of -0.161 and weighted average of 6.0%, a difference of 8.9%.
Ambulatory Disability Correlation Summary
| Measurement | Belizean | Macedonian |
| Minimum | 0.81% | 1.6% |
| Maximum | 15.0% | 10.7% |
| Range | 14.2% | 9.1% |
| Mean | 7.0% | 5.9% |
| Median | 6.8% | 5.9% |
| Interquartile 25% (IQ1) | 5.9% | 5.0% |
| Interquartile 75% (IQ3) | 7.9% | 6.7% |
| Interquartile Range (IQR) | 1.9% | 1.7% |
| Standard Deviation (Sample) | 2.3% | 1.8% |
| Standard Deviation (Population) | 2.3% | 1.8% |
Similar Demographics by Ambulatory Disability
Demographics Similar to Belizeans by Ambulatory Disability
In terms of ambulatory disability, the demographic groups most similar to Belizeans are Welsh (6.5%, a difference of 0.070%), Immigrants from Uzbekistan (6.5%, a difference of 0.15%), Scottish (6.5%, a difference of 0.16%), Immigrants from Bahamas (6.5%, a difference of 0.21%), and Bermudan (6.5%, a difference of 0.23%).
| Demographics | Rating | Rank | Ambulatory Disability |
| Immigrants | Cuba | 1.4 /100 | #247 | Tragic 6.5% |
| Immigrants | Portugal | 1.4 /100 | #248 | Tragic 6.5% |
| Native Hawaiians | 1.1 /100 | #249 | Tragic 6.5% |
| Chinese | 1.0 /100 | #250 | Tragic 6.5% |
| Hawaiians | 0.9 /100 | #251 | Tragic 6.5% |
| Immigrants | Bahamas | 0.8 /100 | #252 | Tragic 6.5% |
| Scottish | 0.7 /100 | #253 | Tragic 6.5% |
| Belizeans | 0.7 /100 | #254 | Tragic 6.5% |
| Welsh | 0.6 /100 | #255 | Tragic 6.5% |
| Immigrants | Uzbekistan | 0.6 /100 | #256 | Tragic 6.5% |
| Bermudans | 0.5 /100 | #257 | Tragic 6.5% |
| Spanish American Indians | 0.5 /100 | #258 | Tragic 6.5% |
| Aleuts | 0.4 /100 | #259 | Tragic 6.6% |
| Immigrants | Belize | 0.4 /100 | #260 | Tragic 6.6% |
| Irish | 0.4 /100 | #261 | Tragic 6.6% |
Demographics Similar to Macedonians by Ambulatory Disability
In terms of ambulatory disability, the demographic groups most similar to Macedonians are Romanian (6.0%, a difference of 0.010%), Immigrants from Philippines (6.0%, a difference of 0.020%), Swedish (6.0%, a difference of 0.030%), Pakistani (6.0%, a difference of 0.030%), and Immigrants from Greece (6.0%, a difference of 0.030%).
| Demographics | Rating | Rank | Ambulatory Disability |
| Immigrants | Syria | 84.1 /100 | #137 | Excellent 6.0% |
| Immigrants | Hungary | 83.9 /100 | #138 | Excellent 6.0% |
| Immigrants | Zaire | 83.6 /100 | #139 | Excellent 6.0% |
| Czechs | 83.3 /100 | #140 | Excellent 6.0% |
| Swedes | 83.1 /100 | #141 | Excellent 6.0% |
| Immigrants | Philippines | 83.0 /100 | #142 | Excellent 6.0% |
| Romanians | 82.9 /100 | #143 | Excellent 6.0% |
| Macedonians | 82.8 /100 | #144 | Excellent 6.0% |
| Pakistanis | 82.5 /100 | #145 | Excellent 6.0% |
| Immigrants | Greece | 82.5 /100 | #146 | Excellent 6.0% |
| Immigrants | Moldova | 82.4 /100 | #147 | Excellent 6.0% |
| Immigrants | Eastern Europe | 82.0 /100 | #148 | Excellent 6.0% |
| Lithuanians | 81.9 /100 | #149 | Excellent 6.0% |
| Maltese | 81.6 /100 | #150 | Excellent 6.0% |
| Greeks | 79.6 /100 | #151 | Good 6.0% |