Immigrants from Nigeria vs Immigrants from Eastern Asia Disability Age Under 5
COMPARE
Immigrants from Nigeria
Immigrants from Eastern Asia
Disability Age Under 5
Disability Age Under 5 Comparison
Immigrants from Nigeria
Immigrants from Eastern Asia
1.2%
DISABILITY AGE UNDER 5
50.0/ 100
METRIC RATING
175th/ 347
METRIC RANK
1.0%
DISABILITY AGE UNDER 5
100.0/ 100
METRIC RATING
28th/ 347
METRIC RANK
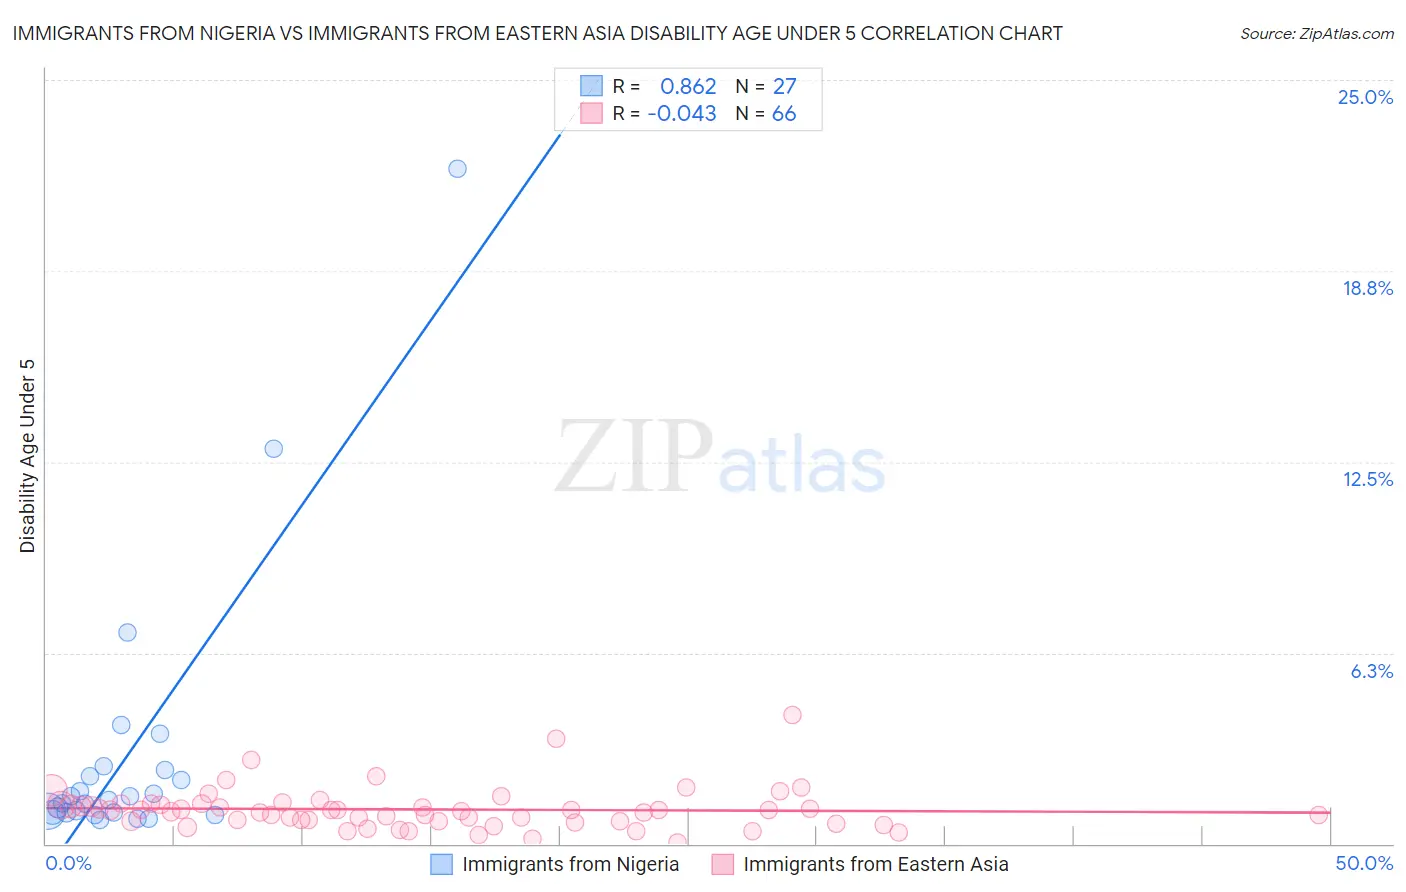
Immigrants from Nigeria vs Immigrants from Eastern Asia Disability Age Under 5 Correlation Chart
The statistical analysis conducted on geographies consisting of 173,767,692 people shows a very strong positive correlation between the proportion of Immigrants from Nigeria and percentage of population with a disability under the age of 5 in the United States with a correlation coefficient (R) of 0.862 and weighted average of 1.2%. Similarly, the statistical analysis conducted on geographies consisting of 247,629,306 people shows no correlation between the proportion of Immigrants from Eastern Asia and percentage of population with a disability under the age of 5 in the United States with a correlation coefficient (R) of -0.043 and weighted average of 1.0%, a difference of 21.4%.
Disability Age Under 5 Correlation Summary
| Measurement | Immigrants from Nigeria | Immigrants from Eastern Asia |
| Minimum | 0.78% | 0.058% |
| Maximum | 22.1% | 4.2% |
| Range | 21.3% | 4.2% |
| Mean | 3.0% | 1.1% |
| Median | 1.4% | 1.1% |
| Interquartile 25% (IQ1) | 1.0% | 0.74% |
| Interquartile 75% (IQ3) | 2.4% | 1.3% |
| Interquartile Range (IQR) | 1.4% | 0.54% |
| Standard Deviation (Sample) | 4.6% | 0.69% |
| Standard Deviation (Population) | 4.5% | 0.69% |
Similar Demographics by Disability Age Under 5
Demographics Similar to Immigrants from Nigeria by Disability Age Under 5
In terms of disability age under 5, the demographic groups most similar to Immigrants from Nigeria are Immigrants from Latvia (1.2%, a difference of 0.0%), Immigrants from Ireland (1.2%, a difference of 0.030%), Crow (1.2%, a difference of 0.090%), Immigrants from Kenya (1.2%, a difference of 0.13%), and Comanche (1.2%, a difference of 0.22%).
| Demographics | Rating | Rank | Disability Age Under 5 |
| Sierra Leoneans | 59.1 /100 | #168 | Average 1.2% |
| Immigrants | Uruguay | 59.0 /100 | #169 | Average 1.2% |
| Immigrants | Jamaica | 58.8 /100 | #170 | Average 1.2% |
| Guamanians/Chamorros | 57.8 /100 | #171 | Average 1.2% |
| Crow | 51.0 /100 | #172 | Average 1.2% |
| Immigrants | Ireland | 50.3 /100 | #173 | Average 1.2% |
| Immigrants | Latvia | 50.0 /100 | #174 | Average 1.2% |
| Immigrants | Nigeria | 50.0 /100 | #175 | Average 1.2% |
| Immigrants | Kenya | 48.6 /100 | #176 | Average 1.2% |
| Comanche | 47.5 /100 | #177 | Average 1.2% |
| Venezuelans | 47.1 /100 | #178 | Average 1.2% |
| Immigrants | Bahamas | 45.2 /100 | #179 | Average 1.2% |
| Immigrants | Mexico | 44.4 /100 | #180 | Average 1.2% |
| Macedonians | 43.7 /100 | #181 | Average 1.2% |
| Immigrants | Peru | 43.7 /100 | #181 | Average 1.2% |
Demographics Similar to Immigrants from Eastern Asia by Disability Age Under 5
In terms of disability age under 5, the demographic groups most similar to Immigrants from Eastern Asia are Immigrants from Belarus (1.0%, a difference of 0.12%), Guyanese (1.0%, a difference of 0.63%), Immigrants from South Central Asia (1.0%, a difference of 0.65%), Armenian (1.0%, a difference of 0.93%), and Iranian (1.0%, a difference of 0.98%).
| Demographics | Rating | Rank | Disability Age Under 5 |
| British West Indians | 100.0 /100 | #21 | Exceptional 0.99% |
| Immigrants | Iran | 100.0 /100 | #22 | Exceptional 1.00% |
| Yakama | 100.0 /100 | #23 | Exceptional 1.00% |
| Indians (Asian) | 100.0 /100 | #24 | Exceptional 1.0% |
| Immigrants | Micronesia | 100.0 /100 | #25 | Exceptional 1.0% |
| Immigrants | Taiwan | 100.0 /100 | #26 | Exceptional 1.0% |
| Guyanese | 100.0 /100 | #27 | Exceptional 1.0% |
| Immigrants | Eastern Asia | 100.0 /100 | #28 | Exceptional 1.0% |
| Immigrants | Belarus | 100.0 /100 | #29 | Exceptional 1.0% |
| Immigrants | South Central Asia | 99.9 /100 | #30 | Exceptional 1.0% |
| Armenians | 99.9 /100 | #31 | Exceptional 1.0% |
| Iranians | 99.9 /100 | #32 | Exceptional 1.0% |
| Bolivians | 99.9 /100 | #33 | Exceptional 1.0% |
| Immigrants | Ukraine | 99.9 /100 | #34 | Exceptional 1.0% |
| Barbadians | 99.9 /100 | #35 | Exceptional 1.0% |