Choctaw vs Nonimmigrants Male Disability
COMPARE
Choctaw
Nonimmigrants
Male Disability
Male Disability Comparison
Choctaw
Nonimmigrants
15.4%
MALE DISABILITY
0.0/ 100
METRIC RATING
341st/ 347
METRIC RANK
12.9%
MALE DISABILITY
0.0/ 100
METRIC RATING
296th/ 347
METRIC RANK
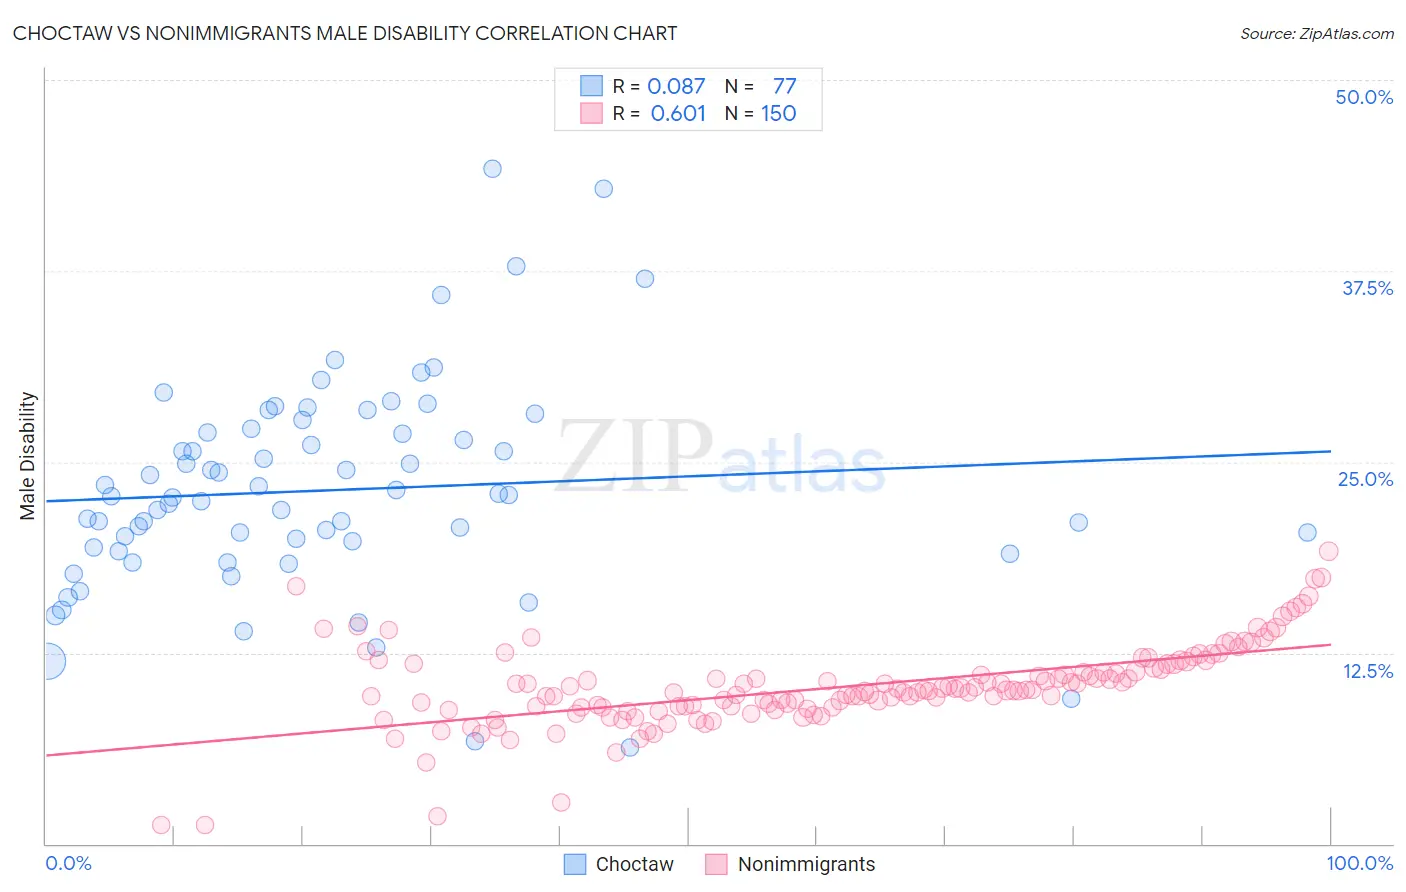
Choctaw vs Nonimmigrants Male Disability Correlation Chart
The statistical analysis conducted on geographies consisting of 269,660,738 people shows a slight positive correlation between the proportion of Choctaw and percentage of males with a disability in the United States with a correlation coefficient (R) of 0.087 and weighted average of 15.4%. Similarly, the statistical analysis conducted on geographies consisting of 584,663,642 people shows a significant positive correlation between the proportion of Nonimmigrants and percentage of males with a disability in the United States with a correlation coefficient (R) of 0.601 and weighted average of 12.9%, a difference of 19.0%.
Male Disability Correlation Summary
| Measurement | Choctaw | Nonimmigrants |
| Minimum | 6.3% | 1.2% |
| Maximum | 44.2% | 19.2% |
| Range | 38.0% | 18.0% |
| Mean | 23.1% | 10.3% |
| Median | 22.8% | 10.0% |
| Interquartile 25% (IQ1) | 19.3% | 8.9% |
| Interquartile 75% (IQ3) | 27.0% | 11.5% |
| Interquartile Range (IQR) | 7.8% | 2.6% |
| Standard Deviation (Sample) | 7.0% | 2.7% |
| Standard Deviation (Population) | 6.9% | 2.7% |
Similar Demographics by Male Disability
Demographics Similar to Choctaw by Male Disability
In terms of male disability, the demographic groups most similar to Choctaw are Kiowa (15.4%, a difference of 0.19%), Creek (15.5%, a difference of 0.85%), Puerto Rican (15.6%, a difference of 0.98%), Lumbee (15.2%, a difference of 1.1%), and Tsimshian (15.6%, a difference of 1.3%).
| Demographics | Rating | Rank | Male Disability |
| Yuman | 0.0 /100 | #333 | Tragic 14.7% |
| Cherokee | 0.0 /100 | #334 | Tragic 14.8% |
| Dutch West Indians | 0.0 /100 | #335 | Tragic 14.8% |
| Alaskan Athabascans | 0.0 /100 | #336 | Tragic 14.9% |
| Menominee | 0.0 /100 | #337 | Tragic 15.0% |
| Pueblo | 0.0 /100 | #338 | Tragic 15.0% |
| Chickasaw | 0.0 /100 | #339 | Tragic 15.1% |
| Lumbee | 0.0 /100 | #340 | Tragic 15.2% |
| Choctaw | 0.0 /100 | #341 | Tragic 15.4% |
| Kiowa | 0.0 /100 | #342 | Tragic 15.4% |
| Creek | 0.0 /100 | #343 | Tragic 15.5% |
| Puerto Ricans | 0.0 /100 | #344 | Tragic 15.6% |
| Tsimshian | 0.0 /100 | #345 | Tragic 15.6% |
| Colville | 0.0 /100 | #346 | Tragic 16.5% |
| Houma | 0.0 /100 | #347 | Tragic 17.4% |
Demographics Similar to Nonimmigrants by Male Disability
In terms of male disability, the demographic groups most similar to Nonimmigrants are Immigrants from Micronesia (12.9%, a difference of 0.070%), Inupiat (13.0%, a difference of 0.11%), Marshallese (12.9%, a difference of 0.16%), Pennsylvania German (13.0%, a difference of 0.31%), and Yaqui (12.9%, a difference of 0.40%).
| Demographics | Rating | Rank | Male Disability |
| Immigrants | Cabo Verde | 0.0 /100 | #289 | Tragic 12.8% |
| Pima | 0.0 /100 | #290 | Tragic 12.8% |
| Whites/Caucasians | 0.0 /100 | #291 | Tragic 12.8% |
| English | 0.0 /100 | #292 | Tragic 12.8% |
| Yaqui | 0.0 /100 | #293 | Tragic 12.9% |
| Marshallese | 0.0 /100 | #294 | Tragic 12.9% |
| Immigrants | Micronesia | 0.0 /100 | #295 | Tragic 12.9% |
| Immigrants | Nonimmigrants | 0.0 /100 | #296 | Tragic 12.9% |
| Inupiat | 0.0 /100 | #297 | Tragic 13.0% |
| Pennsylvania Germans | 0.0 /100 | #298 | Tragic 13.0% |
| Celtics | 0.0 /100 | #299 | Tragic 13.0% |
| Cheyenne | 0.0 /100 | #300 | Tragic 13.0% |
| French | 0.0 /100 | #301 | Tragic 13.0% |
| Crow | 0.0 /100 | #302 | Tragic 13.1% |
| Scotch-Irish | 0.0 /100 | #303 | Tragic 13.2% |