Scottish vs Immigrants from Central America Male Disability
COMPARE
Scottish
Immigrants from Central America
Male Disability
Male Disability Comparison
Scottish
Immigrants from Central America
12.8%
MALE DISABILITY
0.0/ 100
METRIC RATING
286th/ 347
METRIC RANK
11.3%
MALE DISABILITY
32.9/ 100
METRIC RATING
183rd/ 347
METRIC RANK
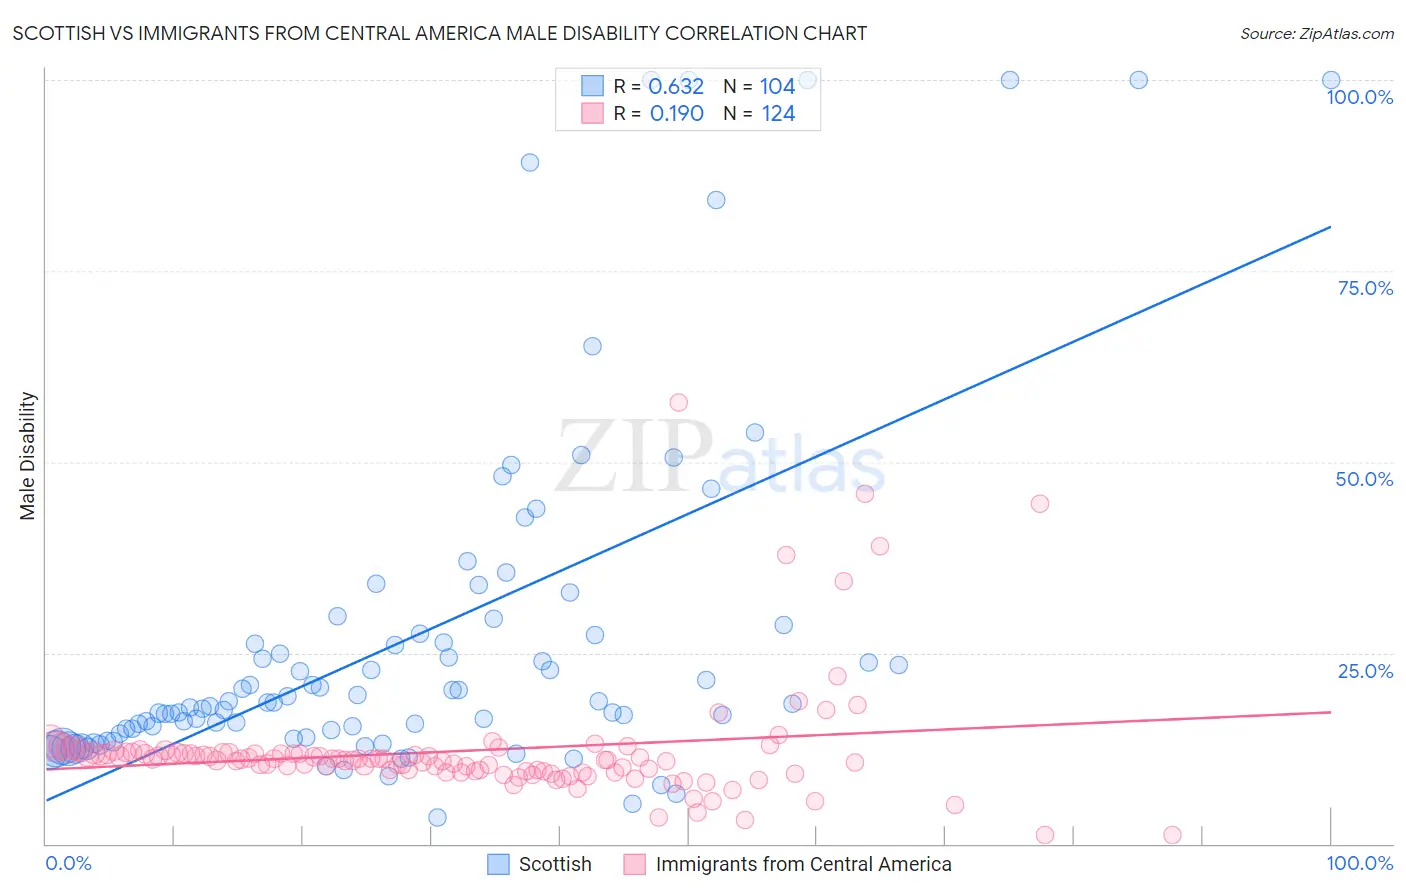
Scottish vs Immigrants from Central America Male Disability Correlation Chart
The statistical analysis conducted on geographies consisting of 566,868,484 people shows a significant positive correlation between the proportion of Scottish and percentage of males with a disability in the United States with a correlation coefficient (R) of 0.632 and weighted average of 12.8%. Similarly, the statistical analysis conducted on geographies consisting of 536,294,553 people shows a poor positive correlation between the proportion of Immigrants from Central America and percentage of males with a disability in the United States with a correlation coefficient (R) of 0.190 and weighted average of 11.3%, a difference of 12.6%.
Male Disability Correlation Summary
| Measurement | Scottish | Immigrants from Central America |
| Minimum | 3.4% | 1.2% |
| Maximum | 100.0% | 57.8% |
| Range | 96.6% | 56.6% |
| Mean | 27.0% | 12.1% |
| Median | 18.4% | 11.1% |
| Interquartile 25% (IQ1) | 14.2% | 9.5% |
| Interquartile 75% (IQ3) | 27.4% | 11.9% |
| Interquartile Range (IQR) | 13.2% | 2.4% |
| Standard Deviation (Sample) | 23.1% | 7.8% |
| Standard Deviation (Population) | 23.0% | 7.7% |
Similar Demographics by Male Disability
Demographics Similar to Scottish by Male Disability
In terms of male disability, the demographic groups most similar to Scottish are Welsh (12.7%, a difference of 0.050%), Spanish (12.7%, a difference of 0.060%), Cape Verdean (12.8%, a difference of 0.070%), Yup'ik (12.8%, a difference of 0.26%), and German (12.7%, a difference of 0.32%).
| Demographics | Rating | Rank | Male Disability |
| Slovaks | 0.0 /100 | #279 | Tragic 12.7% |
| Dutch | 0.0 /100 | #280 | Tragic 12.7% |
| Sioux | 0.0 /100 | #281 | Tragic 12.7% |
| Irish | 0.0 /100 | #282 | Tragic 12.7% |
| Germans | 0.0 /100 | #283 | Tragic 12.7% |
| Spanish | 0.0 /100 | #284 | Tragic 12.7% |
| Welsh | 0.0 /100 | #285 | Tragic 12.7% |
| Scottish | 0.0 /100 | #286 | Tragic 12.8% |
| Cape Verdeans | 0.0 /100 | #287 | Tragic 12.8% |
| Yup'ik | 0.0 /100 | #288 | Tragic 12.8% |
| Immigrants | Cabo Verde | 0.0 /100 | #289 | Tragic 12.8% |
| Pima | 0.0 /100 | #290 | Tragic 12.8% |
| Whites/Caucasians | 0.0 /100 | #291 | Tragic 12.8% |
| English | 0.0 /100 | #292 | Tragic 12.8% |
| Yaqui | 0.0 /100 | #293 | Tragic 12.9% |
Demographics Similar to Immigrants from Central America by Male Disability
In terms of male disability, the demographic groups most similar to Immigrants from Central America are Immigrants from Belize (11.3%, a difference of 0.050%), Immigrants from Senegal (11.3%, a difference of 0.090%), Iraqi (11.3%, a difference of 0.15%), Pakistani (11.3%, a difference of 0.16%), and Immigrants from Zaire (11.4%, a difference of 0.34%).
| Demographics | Rating | Rank | Male Disability |
| Syrians | 46.6 /100 | #176 | Average 11.2% |
| Immigrants | Norway | 44.2 /100 | #177 | Average 11.3% |
| Australians | 42.2 /100 | #178 | Average 11.3% |
| Immigrants | Caribbean | 41.4 /100 | #179 | Average 11.3% |
| Hondurans | 41.1 /100 | #180 | Average 11.3% |
| Immigrants | Senegal | 34.4 /100 | #181 | Fair 11.3% |
| Immigrants | Belize | 33.7 /100 | #182 | Fair 11.3% |
| Immigrants | Central America | 32.9 /100 | #183 | Fair 11.3% |
| Iraqis | 30.5 /100 | #184 | Fair 11.3% |
| Pakistanis | 30.3 /100 | #185 | Fair 11.3% |
| Immigrants | Zaire | 27.6 /100 | #186 | Fair 11.4% |
| Immigrants | Austria | 27.3 /100 | #187 | Fair 11.4% |
| Estonians | 26.8 /100 | #188 | Fair 11.4% |
| Immigrants | Netherlands | 25.9 /100 | #189 | Fair 11.4% |
| Immigrants | Bosnia and Herzegovina | 25.4 /100 | #190 | Fair 11.4% |