Scottish vs Immigrants from Serbia Disability
COMPARE
Scottish
Immigrants from Serbia
Disability
Disability Comparison
Scottish
Immigrants from Serbia
12.9%
DISABILITY
0.0/ 100
METRIC RATING
282nd/ 347
METRIC RANK
11.0%
DISABILITY
99.4/ 100
METRIC RATING
74th/ 347
METRIC RANK
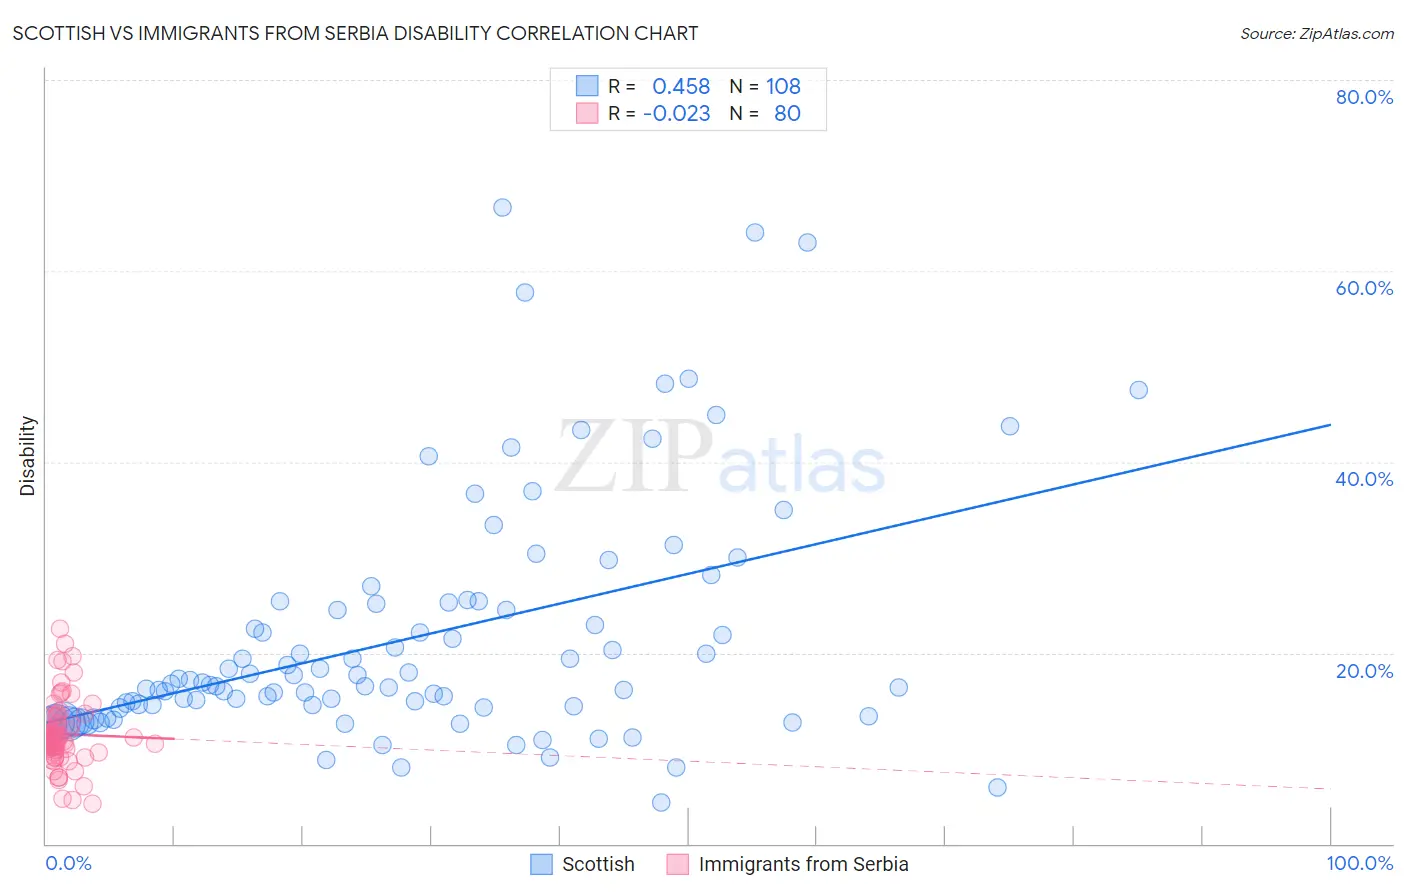
Scottish vs Immigrants from Serbia Disability Correlation Chart
The statistical analysis conducted on geographies consisting of 567,015,833 people shows a moderate positive correlation between the proportion of Scottish and percentage of population with a disability in the United States with a correlation coefficient (R) of 0.458 and weighted average of 12.9%. Similarly, the statistical analysis conducted on geographies consisting of 131,748,462 people shows no correlation between the proportion of Immigrants from Serbia and percentage of population with a disability in the United States with a correlation coefficient (R) of -0.023 and weighted average of 11.0%, a difference of 16.6%.
Disability Correlation Summary
| Measurement | Scottish | Immigrants from Serbia |
| Minimum | 4.3% | 4.2% |
| Maximum | 66.7% | 22.5% |
| Range | 62.3% | 18.3% |
| Mean | 21.6% | 11.5% |
| Median | 16.7% | 11.0% |
| Interquartile 25% (IQ1) | 14.2% | 10.0% |
| Interquartile 75% (IQ3) | 25.2% | 12.6% |
| Interquartile Range (IQR) | 11.0% | 2.6% |
| Standard Deviation (Sample) | 12.7% | 3.5% |
| Standard Deviation (Population) | 12.6% | 3.4% |
Similar Demographics by Disability
Demographics Similar to Scottish by Disability
In terms of disability, the demographic groups most similar to Scottish are Irish (12.9%, a difference of 0.020%), Immigrants from Portugal (12.9%, a difference of 0.14%), Welsh (12.9%, a difference of 0.22%), Crow (12.9%, a difference of 0.22%), and Spanish (12.8%, a difference of 0.28%).
| Demographics | Rating | Rank | Disability |
| Sioux | 0.0 /100 | #275 | Tragic 12.8% |
| Hmong | 0.0 /100 | #276 | Tragic 12.8% |
| Dutch | 0.0 /100 | #277 | Tragic 12.8% |
| Germans | 0.0 /100 | #278 | Tragic 12.8% |
| Fijians | 0.0 /100 | #279 | Tragic 12.8% |
| Spanish | 0.0 /100 | #280 | Tragic 12.8% |
| Immigrants | Portugal | 0.0 /100 | #281 | Tragic 12.9% |
| Scottish | 0.0 /100 | #282 | Tragic 12.9% |
| Irish | 0.0 /100 | #283 | Tragic 12.9% |
| Welsh | 0.0 /100 | #284 | Tragic 12.9% |
| Crow | 0.0 /100 | #285 | Tragic 12.9% |
| English | 0.0 /100 | #286 | Tragic 13.0% |
| Africans | 0.0 /100 | #287 | Tragic 13.0% |
| Whites/Caucasians | 0.0 /100 | #288 | Tragic 13.0% |
| Slovaks | 0.0 /100 | #289 | Tragic 13.0% |
Demographics Similar to Immigrants from Serbia by Disability
In terms of disability, the demographic groups most similar to Immigrants from Serbia are Immigrants from Bangladesh (11.0%, a difference of 0.020%), Immigrants from Vietnam (11.0%, a difference of 0.020%), Immigrants from Chile (11.0%, a difference of 0.040%), Sierra Leonean (11.0%, a difference of 0.050%), and Immigrants from Belgium (11.0%, a difference of 0.050%).
| Demographics | Rating | Rank | Disability |
| Colombians | 99.6 /100 | #67 | Exceptional 11.0% |
| Immigrants | Afghanistan | 99.6 /100 | #68 | Exceptional 11.0% |
| Sri Lankans | 99.5 /100 | #69 | Exceptional 11.0% |
| Immigrants | France | 99.4 /100 | #70 | Exceptional 11.0% |
| Immigrants | Lebanon | 99.4 /100 | #71 | Exceptional 11.0% |
| Immigrants | Chile | 99.4 /100 | #72 | Exceptional 11.0% |
| Immigrants | Bangladesh | 99.4 /100 | #73 | Exceptional 11.0% |
| Immigrants | Serbia | 99.4 /100 | #74 | Exceptional 11.0% |
| Immigrants | Vietnam | 99.4 /100 | #75 | Exceptional 11.0% |
| Sierra Leoneans | 99.3 /100 | #76 | Exceptional 11.0% |
| Immigrants | Belgium | 99.3 /100 | #77 | Exceptional 11.0% |
| Immigrants | Cameroon | 99.3 /100 | #78 | Exceptional 11.1% |
| Immigrants | Jordan | 99.3 /100 | #79 | Exceptional 11.1% |
| Immigrants | Ireland | 99.3 /100 | #80 | Exceptional 11.1% |
| Immigrants | Poland | 99.1 /100 | #81 | Exceptional 11.1% |