Scottish vs Cuban Disability
COMPARE
Scottish
Cuban
Disability
Disability Comparison
Scottish
Cubans
12.9%
DISABILITY
0.0/ 100
METRIC RATING
282nd/ 347
METRIC RANK
11.7%
DISABILITY
56.7/ 100
METRIC RATING
165th/ 347
METRIC RANK
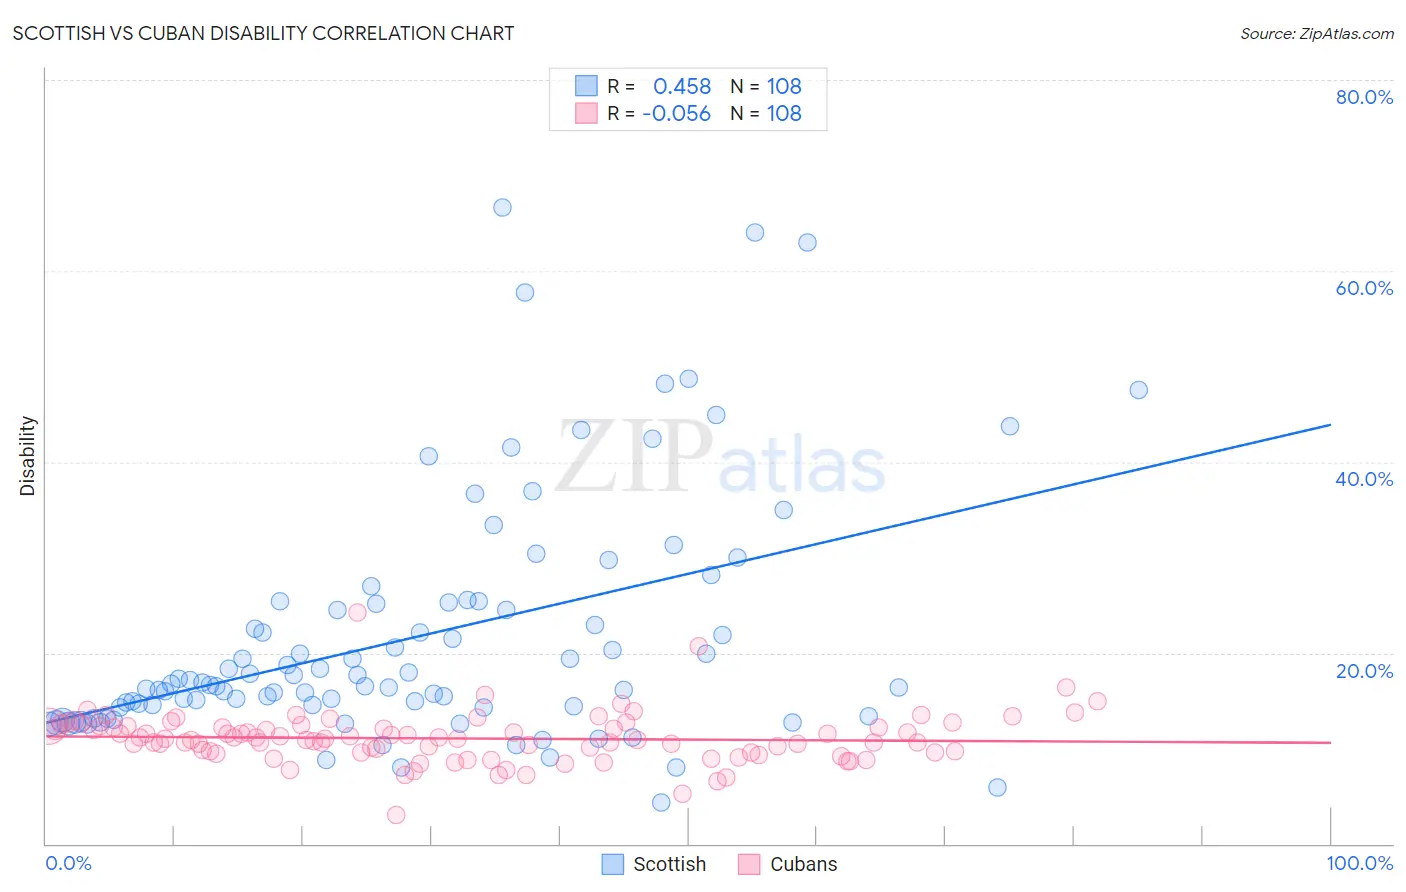
Scottish vs Cuban Disability Correlation Chart
The statistical analysis conducted on geographies consisting of 567,015,833 people shows a moderate positive correlation between the proportion of Scottish and percentage of population with a disability in the United States with a correlation coefficient (R) of 0.458 and weighted average of 12.9%. Similarly, the statistical analysis conducted on geographies consisting of 449,280,582 people shows a slight negative correlation between the proportion of Cubans and percentage of population with a disability in the United States with a correlation coefficient (R) of -0.056 and weighted average of 11.7%, a difference of 10.4%.
Disability Correlation Summary
| Measurement | Scottish | Cuban |
| Minimum | 4.3% | 3.1% |
| Maximum | 66.7% | 24.2% |
| Range | 62.3% | 21.1% |
| Mean | 21.6% | 11.0% |
| Median | 16.7% | 11.0% |
| Interquartile 25% (IQ1) | 14.2% | 9.6% |
| Interquartile 75% (IQ3) | 25.2% | 12.3% |
| Interquartile Range (IQR) | 11.0% | 2.7% |
| Standard Deviation (Sample) | 12.7% | 2.7% |
| Standard Deviation (Population) | 12.6% | 2.6% |
Similar Demographics by Disability
Demographics Similar to Scottish by Disability
In terms of disability, the demographic groups most similar to Scottish are Irish (12.9%, a difference of 0.020%), Immigrants from Portugal (12.9%, a difference of 0.14%), Welsh (12.9%, a difference of 0.22%), Crow (12.9%, a difference of 0.22%), and Spanish (12.8%, a difference of 0.28%).
| Demographics | Rating | Rank | Disability |
| Sioux | 0.0 /100 | #275 | Tragic 12.8% |
| Hmong | 0.0 /100 | #276 | Tragic 12.8% |
| Dutch | 0.0 /100 | #277 | Tragic 12.8% |
| Germans | 0.0 /100 | #278 | Tragic 12.8% |
| Fijians | 0.0 /100 | #279 | Tragic 12.8% |
| Spanish | 0.0 /100 | #280 | Tragic 12.8% |
| Immigrants | Portugal | 0.0 /100 | #281 | Tragic 12.9% |
| Scottish | 0.0 /100 | #282 | Tragic 12.9% |
| Irish | 0.0 /100 | #283 | Tragic 12.9% |
| Welsh | 0.0 /100 | #284 | Tragic 12.9% |
| Crow | 0.0 /100 | #285 | Tragic 12.9% |
| English | 0.0 /100 | #286 | Tragic 13.0% |
| Africans | 0.0 /100 | #287 | Tragic 13.0% |
| Whites/Caucasians | 0.0 /100 | #288 | Tragic 13.0% |
| Slovaks | 0.0 /100 | #289 | Tragic 13.0% |
Demographics Similar to Cubans by Disability
In terms of disability, the demographic groups most similar to Cubans are Syrian (11.7%, a difference of 0.080%), Pakistani (11.7%, a difference of 0.090%), Immigrants from Trinidad and Tobago (11.7%, a difference of 0.10%), Estonian (11.7%, a difference of 0.10%), and Immigrants from Haiti (11.7%, a difference of 0.12%).
| Demographics | Rating | Rank | Disability |
| Armenians | 65.9 /100 | #158 | Good 11.6% |
| Guatemalans | 65.1 /100 | #159 | Good 11.6% |
| Immigrants | Barbados | 64.2 /100 | #160 | Good 11.6% |
| Immigrants | Cuba | 62.8 /100 | #161 | Good 11.6% |
| Immigrants | Haiti | 59.2 /100 | #162 | Average 11.7% |
| Immigrants | Trinidad and Tobago | 58.9 /100 | #163 | Average 11.7% |
| Syrians | 58.5 /100 | #164 | Average 11.7% |
| Cubans | 56.7 /100 | #165 | Average 11.7% |
| Pakistanis | 54.7 /100 | #166 | Average 11.7% |
| Estonians | 54.4 /100 | #167 | Average 11.7% |
| Immigrants | Latin America | 54.1 /100 | #168 | Average 11.7% |
| Immigrants | Austria | 53.4 /100 | #169 | Average 11.7% |
| Immigrants | Albania | 52.8 /100 | #170 | Average 11.7% |
| Immigrants | Southern Europe | 52.8 /100 | #171 | Average 11.7% |
| Trinidadians and Tobagonians | 52.7 /100 | #172 | Average 11.7% |