Jordanian vs Immigrants from Serbia Disability
COMPARE
Jordanian
Immigrants from Serbia
Disability
Disability Comparison
Jordanians
Immigrants from Serbia
10.9%
DISABILITY
99.8/ 100
METRIC RATING
54th/ 347
METRIC RANK
11.0%
DISABILITY
99.4/ 100
METRIC RATING
74th/ 347
METRIC RANK
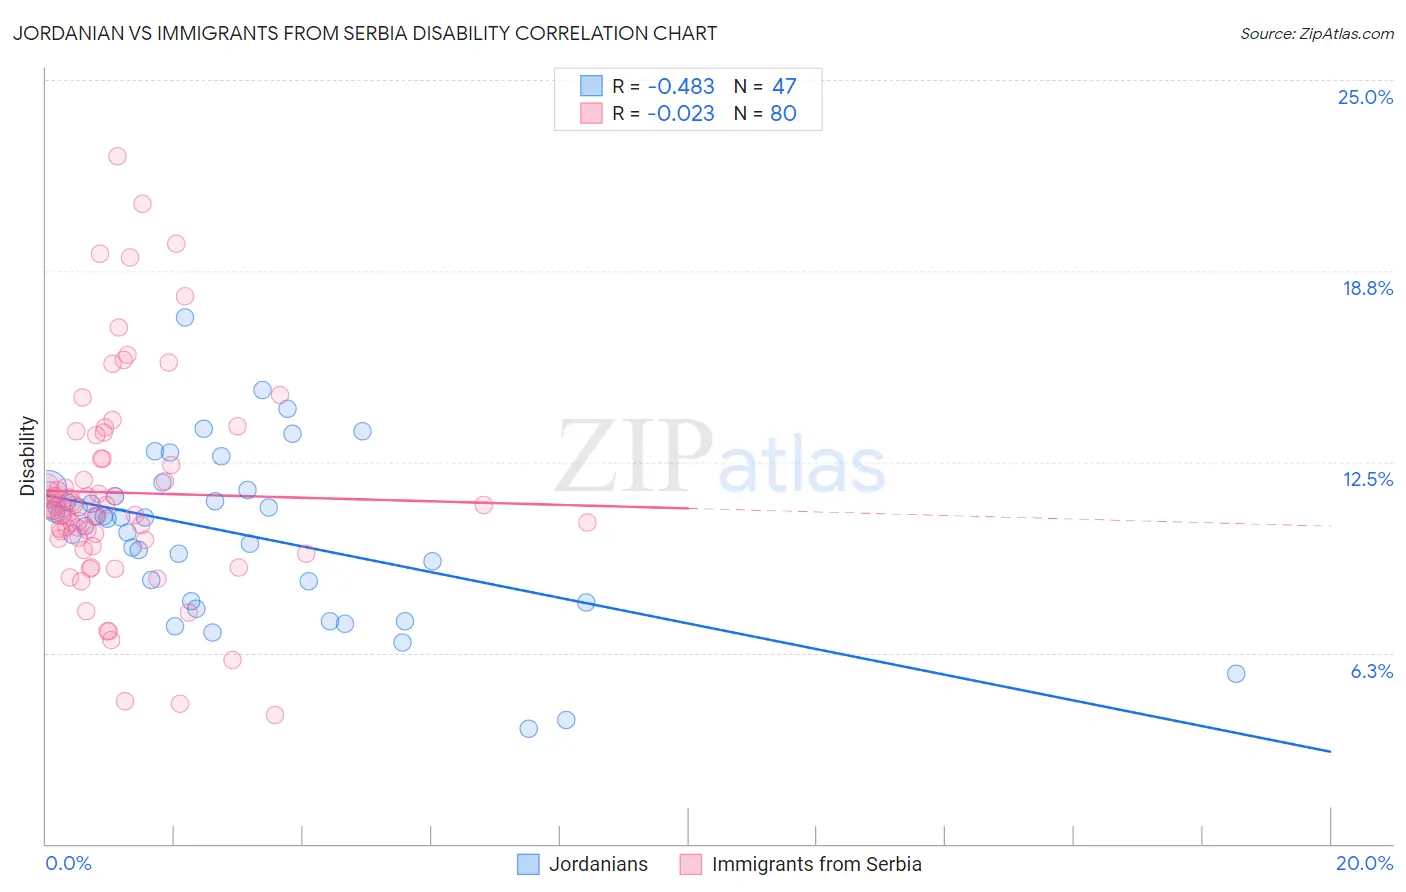
Jordanian vs Immigrants from Serbia Disability Correlation Chart
The statistical analysis conducted on geographies consisting of 166,416,962 people shows a moderate negative correlation between the proportion of Jordanians and percentage of population with a disability in the United States with a correlation coefficient (R) of -0.483 and weighted average of 10.9%. Similarly, the statistical analysis conducted on geographies consisting of 131,748,462 people shows no correlation between the proportion of Immigrants from Serbia and percentage of population with a disability in the United States with a correlation coefficient (R) of -0.023 and weighted average of 11.0%, a difference of 1.6%.
Disability Correlation Summary
| Measurement | Jordanian | Immigrants from Serbia |
| Minimum | 3.7% | 4.2% |
| Maximum | 17.2% | 22.5% |
| Range | 13.5% | 18.3% |
| Mean | 10.2% | 11.5% |
| Median | 10.7% | 11.0% |
| Interquartile 25% (IQ1) | 7.9% | 10.0% |
| Interquartile 75% (IQ3) | 11.6% | 12.6% |
| Interquartile Range (IQR) | 3.7% | 2.6% |
| Standard Deviation (Sample) | 2.7% | 3.5% |
| Standard Deviation (Population) | 2.7% | 3.4% |
Demographics Similar to Jordanians and Immigrants from Serbia by Disability
In terms of disability, the demographic groups most similar to Jordanians are Immigrants from El Salvador (10.9%, a difference of 0.090%), Immigrants from Lithuania (10.9%, a difference of 0.20%), Salvadoran (10.9%, a difference of 0.44%), Immigrants from South America (10.9%, a difference of 0.47%), and Immigrants from Colombia (10.9%, a difference of 0.56%). Similarly, the demographic groups most similar to Immigrants from Serbia are Immigrants from Bangladesh (11.0%, a difference of 0.020%), Immigrants from Chile (11.0%, a difference of 0.040%), Immigrants from Lebanon (11.0%, a difference of 0.13%), Immigrants from France (11.0%, a difference of 0.15%), and Sri Lankan (11.0%, a difference of 0.22%).
| Demographics | Rating | Rank | Disability |
| Jordanians | 99.8 /100 | #54 | Exceptional 10.9% |
| Immigrants | El Salvador | 99.8 /100 | #55 | Exceptional 10.9% |
| Immigrants | Lithuania | 99.8 /100 | #56 | Exceptional 10.9% |
| Salvadorans | 99.8 /100 | #57 | Exceptional 10.9% |
| Immigrants | South America | 99.8 /100 | #58 | Exceptional 10.9% |
| Immigrants | Colombia | 99.7 /100 | #59 | Exceptional 10.9% |
| Zimbabweans | 99.7 /100 | #60 | Exceptional 10.9% |
| Immigrants | Bulgaria | 99.7 /100 | #61 | Exceptional 10.9% |
| Immigrants | Northern Africa | 99.7 /100 | #62 | Exceptional 10.9% |
| Immigrants | Eritrea | 99.7 /100 | #63 | Exceptional 11.0% |
| Immigrants | Sweden | 99.6 /100 | #64 | Exceptional 11.0% |
| Bulgarians | 99.6 /100 | #65 | Exceptional 11.0% |
| Laotians | 99.6 /100 | #66 | Exceptional 11.0% |
| Colombians | 99.6 /100 | #67 | Exceptional 11.0% |
| Immigrants | Afghanistan | 99.6 /100 | #68 | Exceptional 11.0% |
| Sri Lankans | 99.5 /100 | #69 | Exceptional 11.0% |
| Immigrants | France | 99.4 /100 | #70 | Exceptional 11.0% |
| Immigrants | Lebanon | 99.4 /100 | #71 | Exceptional 11.0% |
| Immigrants | Chile | 99.4 /100 | #72 | Exceptional 11.0% |
| Immigrants | Bangladesh | 99.4 /100 | #73 | Exceptional 11.0% |
| Immigrants | Serbia | 99.4 /100 | #74 | Exceptional 11.0% |