Scottish vs Immigrants from Serbia In Labor Force | Age 35-44
COMPARE
Scottish
Immigrants from Serbia
In Labor Force | Age 35-44
In Labor Force | Age 35-44 Comparison
Scottish
Immigrants from Serbia
83.9%
IN LABOR FORCE | AGE 35-44
3.2/ 100
METRIC RATING
231st/ 347
METRIC RANK
85.5%
IN LABOR FORCE | AGE 35-44
100.0/ 100
METRIC RATING
20th/ 347
METRIC RANK
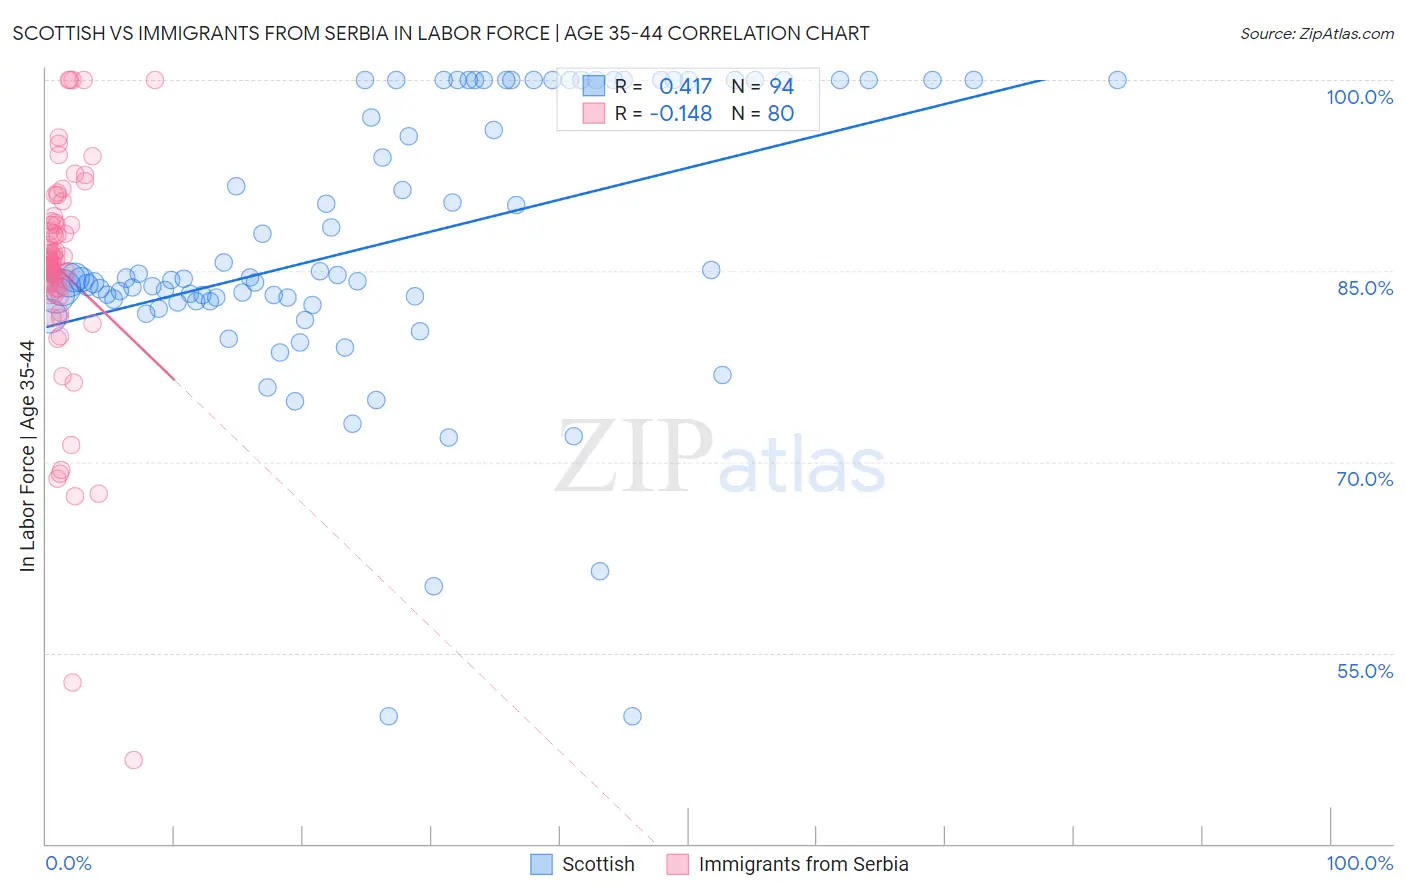
Scottish vs Immigrants from Serbia In Labor Force | Age 35-44 Correlation Chart
The statistical analysis conducted on geographies consisting of 566,464,566 people shows a moderate positive correlation between the proportion of Scottish and labor force participation rate among population between the ages 35 and 44 in the United States with a correlation coefficient (R) of 0.417 and weighted average of 83.9%. Similarly, the statistical analysis conducted on geographies consisting of 131,723,933 people shows a poor negative correlation between the proportion of Immigrants from Serbia and labor force participation rate among population between the ages 35 and 44 in the United States with a correlation coefficient (R) of -0.148 and weighted average of 85.5%, a difference of 1.9%.
In Labor Force | Age 35-44 Correlation Summary
| Measurement | Scottish | Immigrants from Serbia |
| Minimum | 50.0% | 46.6% |
| Maximum | 100.0% | 100.0% |
| Range | 50.0% | 53.4% |
| Mean | 87.1% | 85.0% |
| Median | 84.4% | 85.7% |
| Interquartile 25% (IQ1) | 82.6% | 83.6% |
| Interquartile 75% (IQ3) | 100.0% | 88.7% |
| Interquartile Range (IQR) | 17.4% | 5.1% |
| Standard Deviation (Sample) | 10.9% | 9.0% |
| Standard Deviation (Population) | 10.8% | 8.9% |
Similar Demographics by In Labor Force | Age 35-44
Demographics Similar to Scottish by In Labor Force | Age 35-44
In terms of in labor force | age 35-44, the demographic groups most similar to Scottish are Native Hawaiian (83.9%, a difference of 0.010%), Immigrants from Germany (83.9%, a difference of 0.020%), Immigrants from Iraq (83.9%, a difference of 0.030%), Immigrants from Oceania (83.9%, a difference of 0.030%), and Immigrants from Syria (83.9%, a difference of 0.040%).
| Demographics | Rating | Rank | In Labor Force | Age 35-44 |
| U.S. Virgin Islanders | 6.1 /100 | #224 | Tragic 84.0% |
| Immigrants | Burma/Myanmar | 6.1 /100 | #225 | Tragic 84.0% |
| Panamanians | 5.4 /100 | #226 | Tragic 84.0% |
| British West Indians | 5.3 /100 | #227 | Tragic 84.0% |
| Welsh | 5.3 /100 | #228 | Tragic 84.0% |
| Immigrants | Thailand | 4.7 /100 | #229 | Tragic 84.0% |
| Immigrants | Iraq | 3.7 /100 | #230 | Tragic 83.9% |
| Scottish | 3.2 /100 | #231 | Tragic 83.9% |
| Native Hawaiians | 3.0 /100 | #232 | Tragic 83.9% |
| Immigrants | Germany | 2.8 /100 | #233 | Tragic 83.9% |
| Immigrants | Oceania | 2.6 /100 | #234 | Tragic 83.9% |
| Immigrants | Syria | 2.5 /100 | #235 | Tragic 83.9% |
| West Indians | 2.4 /100 | #236 | Tragic 83.9% |
| English | 1.8 /100 | #237 | Tragic 83.8% |
| Immigrants | Laos | 1.7 /100 | #238 | Tragic 83.8% |
Demographics Similar to Immigrants from Serbia by In Labor Force | Age 35-44
In terms of in labor force | age 35-44, the demographic groups most similar to Immigrants from Serbia are Slovene (85.6%, a difference of 0.040%), Immigrants from North Macedonia (85.6%, a difference of 0.050%), Carpatho Rusyn (85.6%, a difference of 0.050%), Bulgarian (85.5%, a difference of 0.060%), and Norwegian (85.6%, a difference of 0.10%).
| Demographics | Rating | Rank | In Labor Force | Age 35-44 |
| Somalis | 100.0 /100 | #13 | Exceptional 85.6% |
| Immigrants | Somalia | 100.0 /100 | #14 | Exceptional 85.6% |
| Norwegians | 100.0 /100 | #15 | Exceptional 85.6% |
| Immigrants | Ireland | 100.0 /100 | #16 | Exceptional 85.6% |
| Immigrants | North Macedonia | 100.0 /100 | #17 | Exceptional 85.6% |
| Carpatho Rusyns | 100.0 /100 | #18 | Exceptional 85.6% |
| Slovenes | 100.0 /100 | #19 | Exceptional 85.6% |
| Immigrants | Serbia | 100.0 /100 | #20 | Exceptional 85.5% |
| Bulgarians | 100.0 /100 | #21 | Exceptional 85.5% |
| Immigrants | Bosnia and Herzegovina | 100.0 /100 | #22 | Exceptional 85.4% |
| Immigrants | Eastern Africa | 100.0 /100 | #23 | Exceptional 85.4% |
| Latvians | 99.9 /100 | #24 | Exceptional 85.4% |
| Paraguayans | 99.9 /100 | #25 | Exceptional 85.4% |
| Immigrants | Liberia | 99.9 /100 | #26 | Exceptional 85.4% |
| Immigrants | Lithuania | 99.9 /100 | #27 | Exceptional 85.4% |