Delaware vs Immigrants from Asia Female Disability
COMPARE
Delaware
Immigrants from Asia
Female Disability
Female Disability Comparison
Delaware
Immigrants from Asia
13.8%
FEMALE DISABILITY
0.0/ 100
METRIC RATING
312th/ 347
METRIC RANK
11.0%
FEMALE DISABILITY
100.0/ 100
METRIC RATING
25th/ 347
METRIC RANK
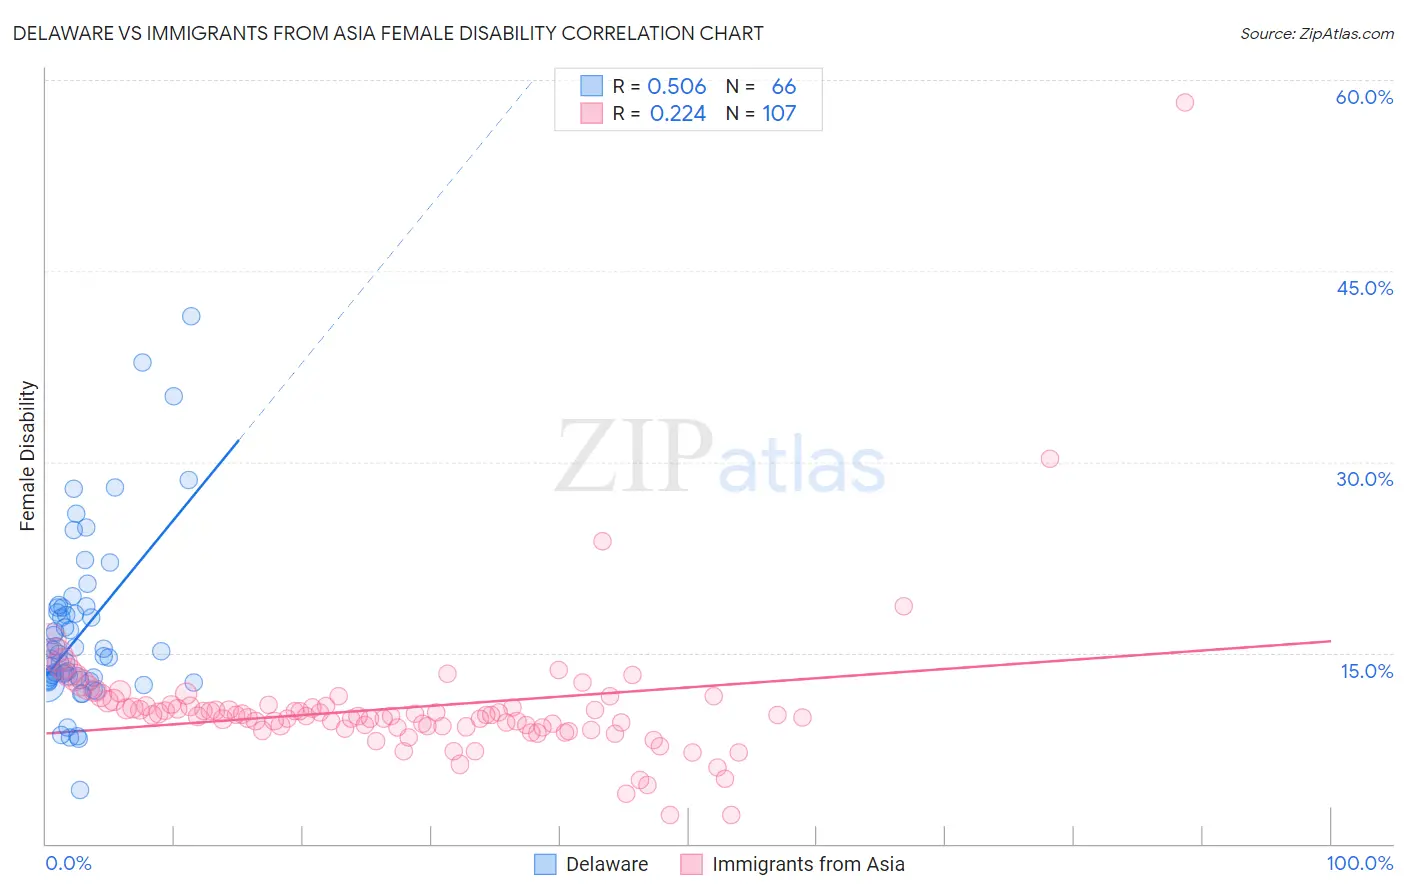
Delaware vs Immigrants from Asia Female Disability Correlation Chart
The statistical analysis conducted on geographies consisting of 96,239,773 people shows a substantial positive correlation between the proportion of Delaware and percentage of females with a disability in the United States with a correlation coefficient (R) of 0.506 and weighted average of 13.8%. Similarly, the statistical analysis conducted on geographies consisting of 548,970,010 people shows a weak positive correlation between the proportion of Immigrants from Asia and percentage of females with a disability in the United States with a correlation coefficient (R) of 0.224 and weighted average of 11.0%, a difference of 25.2%.
Female Disability Correlation Summary
| Measurement | Delaware | Immigrants from Asia |
| Minimum | 4.2% | 2.2% |
| Maximum | 41.4% | 58.2% |
| Range | 37.2% | 56.0% |
| Mean | 16.6% | 10.7% |
| Median | 14.8% | 10.1% |
| Interquartile 25% (IQ1) | 12.8% | 9.2% |
| Interquartile 75% (IQ3) | 18.5% | 10.8% |
| Interquartile Range (IQR) | 5.7% | 1.7% |
| Standard Deviation (Sample) | 6.8% | 5.7% |
| Standard Deviation (Population) | 6.7% | 5.7% |
Similar Demographics by Female Disability
Demographics Similar to Delaware by Female Disability
In terms of female disability, the demographic groups most similar to Delaware are Hopi (13.7%, a difference of 0.31%), Blackfeet (13.8%, a difference of 0.32%), Puget Sound Salish (13.8%, a difference of 0.42%), Apache (13.7%, a difference of 0.60%), and French American Indian (13.7%, a difference of 0.72%).
| Demographics | Rating | Rank | Female Disability |
| Dominicans | 0.0 /100 | #305 | Tragic 13.5% |
| French Canadians | 0.0 /100 | #306 | Tragic 13.6% |
| Central American Indians | 0.0 /100 | #307 | Tragic 13.6% |
| Cree | 0.0 /100 | #308 | Tragic 13.7% |
| French American Indians | 0.0 /100 | #309 | Tragic 13.7% |
| Apache | 0.0 /100 | #310 | Tragic 13.7% |
| Hopi | 0.0 /100 | #311 | Tragic 13.7% |
| Delaware | 0.0 /100 | #312 | Tragic 13.8% |
| Blackfeet | 0.0 /100 | #313 | Tragic 13.8% |
| Puget Sound Salish | 0.0 /100 | #314 | Tragic 13.8% |
| Alaskan Athabascans | 0.0 /100 | #315 | Tragic 13.9% |
| Spanish Americans | 0.0 /100 | #316 | Tragic 14.0% |
| Chippewa | 0.0 /100 | #317 | Tragic 14.0% |
| Paiute | 0.0 /100 | #318 | Tragic 14.0% |
| Iroquois | 0.0 /100 | #319 | Tragic 14.0% |
Demographics Similar to Immigrants from Asia by Female Disability
In terms of female disability, the demographic groups most similar to Immigrants from Asia are Immigrants from Argentina (11.0%, a difference of 0.030%), Argentinean (11.0%, a difference of 0.040%), Immigrants from Turkey (11.1%, a difference of 0.44%), Venezuelan (11.0%, a difference of 0.59%), and Egyptian (11.1%, a difference of 0.72%).
| Demographics | Rating | Rank | Female Disability |
| Immigrants | Iran | 100.0 /100 | #18 | Exceptional 10.8% |
| Immigrants | Venezuela | 100.0 /100 | #19 | Exceptional 10.9% |
| Immigrants | Pakistan | 100.0 /100 | #20 | Exceptional 10.9% |
| Asians | 100.0 /100 | #21 | Exceptional 10.9% |
| Immigrants | Sri Lanka | 100.0 /100 | #22 | Exceptional 10.9% |
| Venezuelans | 100.0 /100 | #23 | Exceptional 11.0% |
| Immigrants | Argentina | 100.0 /100 | #24 | Exceptional 11.0% |
| Immigrants | Asia | 100.0 /100 | #25 | Exceptional 11.0% |
| Argentineans | 100.0 /100 | #26 | Exceptional 11.0% |
| Immigrants | Turkey | 100.0 /100 | #27 | Exceptional 11.1% |
| Egyptians | 100.0 /100 | #28 | Exceptional 11.1% |
| Immigrants | Malaysia | 100.0 /100 | #29 | Exceptional 11.1% |
| Turks | 100.0 /100 | #30 | Exceptional 11.1% |
| Immigrants | Kuwait | 100.0 /100 | #31 | Exceptional 11.1% |
| Immigrants | Australia | 100.0 /100 | #32 | Exceptional 11.1% |