Scottish vs Immigrants from Asia Vision Disability
COMPARE
Scottish
Immigrants from Asia
Vision Disability
Vision Disability Comparison
Scottish
Immigrants from Asia
2.3%
VISION DISABILITY
1.6/ 100
METRIC RATING
234th/ 347
METRIC RANK
1.9%
VISION DISABILITY
99.9/ 100
METRIC RATING
23rd/ 347
METRIC RANK
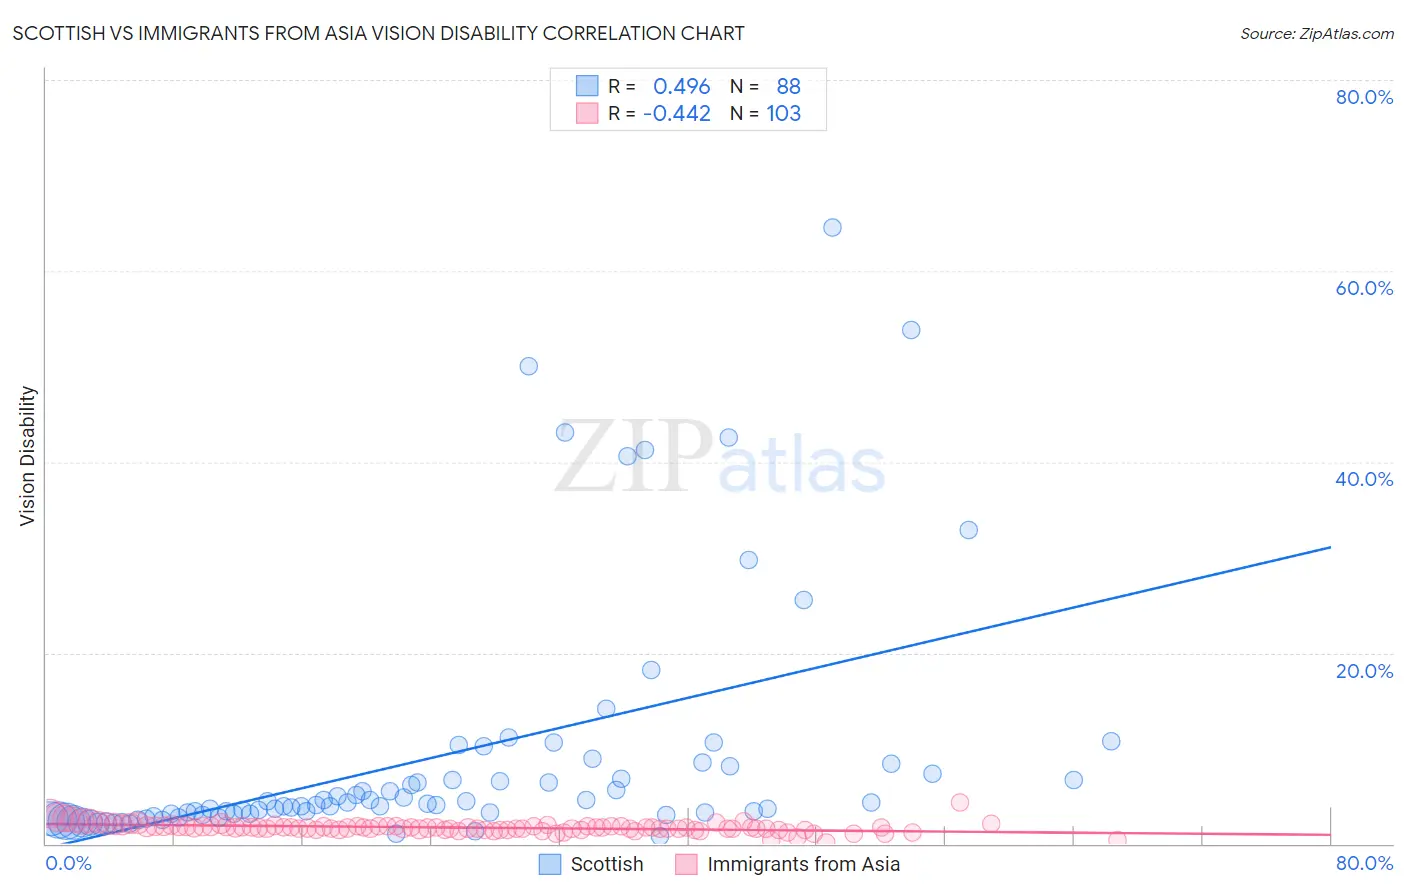
Scottish vs Immigrants from Asia Vision Disability Correlation Chart
The statistical analysis conducted on geographies consisting of 565,142,315 people shows a moderate positive correlation between the proportion of Scottish and percentage of population with vision disability in the United States with a correlation coefficient (R) of 0.496 and weighted average of 2.3%. Similarly, the statistical analysis conducted on geographies consisting of 547,864,164 people shows a moderate negative correlation between the proportion of Immigrants from Asia and percentage of population with vision disability in the United States with a correlation coefficient (R) of -0.442 and weighted average of 1.9%, a difference of 20.4%.
Vision Disability Correlation Summary
| Measurement | Scottish | Immigrants from Asia |
| Minimum | 0.83% | 0.11% |
| Maximum | 64.6% | 4.3% |
| Range | 63.8% | 4.2% |
| Mean | 9.1% | 1.7% |
| Median | 4.1% | 1.7% |
| Interquartile 25% (IQ1) | 3.0% | 1.5% |
| Interquartile 75% (IQ3) | 7.7% | 1.8% |
| Interquartile Range (IQR) | 4.7% | 0.32% |
| Standard Deviation (Sample) | 12.9% | 0.51% |
| Standard Deviation (Population) | 12.8% | 0.51% |
Similar Demographics by Vision Disability
Demographics Similar to Scottish by Vision Disability
In terms of vision disability, the demographic groups most similar to Scottish are Marshallese (2.3%, a difference of 0.070%), Immigrants from Congo (2.3%, a difference of 0.16%), Central American (2.3%, a difference of 0.18%), German Russian (2.3%, a difference of 0.20%), and Immigrants from Portugal (2.3%, a difference of 0.21%).
| Demographics | Rating | Rank | Vision Disability |
| Hawaiians | 2.9 /100 | #227 | Tragic 2.3% |
| Hmong | 2.5 /100 | #228 | Tragic 2.3% |
| Welsh | 2.3 /100 | #229 | Tragic 2.3% |
| Nicaraguans | 2.2 /100 | #230 | Tragic 2.3% |
| Immigrants | Ecuador | 2.0 /100 | #231 | Tragic 2.3% |
| German Russians | 1.8 /100 | #232 | Tragic 2.3% |
| Central Americans | 1.8 /100 | #233 | Tragic 2.3% |
| Scottish | 1.6 /100 | #234 | Tragic 2.3% |
| Marshallese | 1.5 /100 | #235 | Tragic 2.3% |
| Immigrants | Congo | 1.4 /100 | #236 | Tragic 2.3% |
| Immigrants | Portugal | 1.4 /100 | #237 | Tragic 2.3% |
| Immigrants | Cambodia | 1.1 /100 | #238 | Tragic 2.3% |
| English | 1.1 /100 | #239 | Tragic 2.3% |
| Panamanians | 0.9 /100 | #240 | Tragic 2.3% |
| Malaysians | 0.9 /100 | #241 | Tragic 2.3% |
Demographics Similar to Immigrants from Asia by Vision Disability
In terms of vision disability, the demographic groups most similar to Immigrants from Asia are Immigrants from Lithuania (1.9%, a difference of 0.12%), Bulgarian (1.9%, a difference of 0.16%), Immigrants from Japan (1.9%, a difference of 0.20%), Immigrants from Pakistan (1.9%, a difference of 0.54%), and Taiwanese (1.9%, a difference of 0.54%).
| Demographics | Rating | Rank | Vision Disability |
| Indians (Asian) | 100.0 /100 | #16 | Exceptional 1.8% |
| Burmese | 100.0 /100 | #17 | Exceptional 1.8% |
| Bolivians | 100.0 /100 | #18 | Exceptional 1.9% |
| Immigrants | Sri Lanka | 100.0 /100 | #19 | Exceptional 1.9% |
| Asians | 100.0 /100 | #20 | Exceptional 1.9% |
| Turks | 100.0 /100 | #21 | Exceptional 1.9% |
| Immigrants | Pakistan | 100.0 /100 | #22 | Exceptional 1.9% |
| Immigrants | Asia | 99.9 /100 | #23 | Exceptional 1.9% |
| Immigrants | Lithuania | 99.9 /100 | #24 | Exceptional 1.9% |
| Bulgarians | 99.9 /100 | #25 | Exceptional 1.9% |
| Immigrants | Japan | 99.9 /100 | #26 | Exceptional 1.9% |
| Taiwanese | 99.9 /100 | #27 | Exceptional 1.9% |
| Immigrants | Malaysia | 99.9 /100 | #28 | Exceptional 1.9% |
| Egyptians | 99.9 /100 | #29 | Exceptional 1.9% |
| Immigrants | Nepal | 99.9 /100 | #30 | Exceptional 1.9% |