Scotch-Irish vs Immigrants from Guyana Male Disability
COMPARE
Scotch-Irish
Immigrants from Guyana
Male Disability
Male Disability Comparison
Scotch-Irish
Immigrants from Guyana
13.2%
MALE DISABILITY
0.0/ 100
METRIC RATING
303rd/ 347
METRIC RANK
10.6%
MALE DISABILITY
98.2/ 100
METRIC RATING
82nd/ 347
METRIC RANK
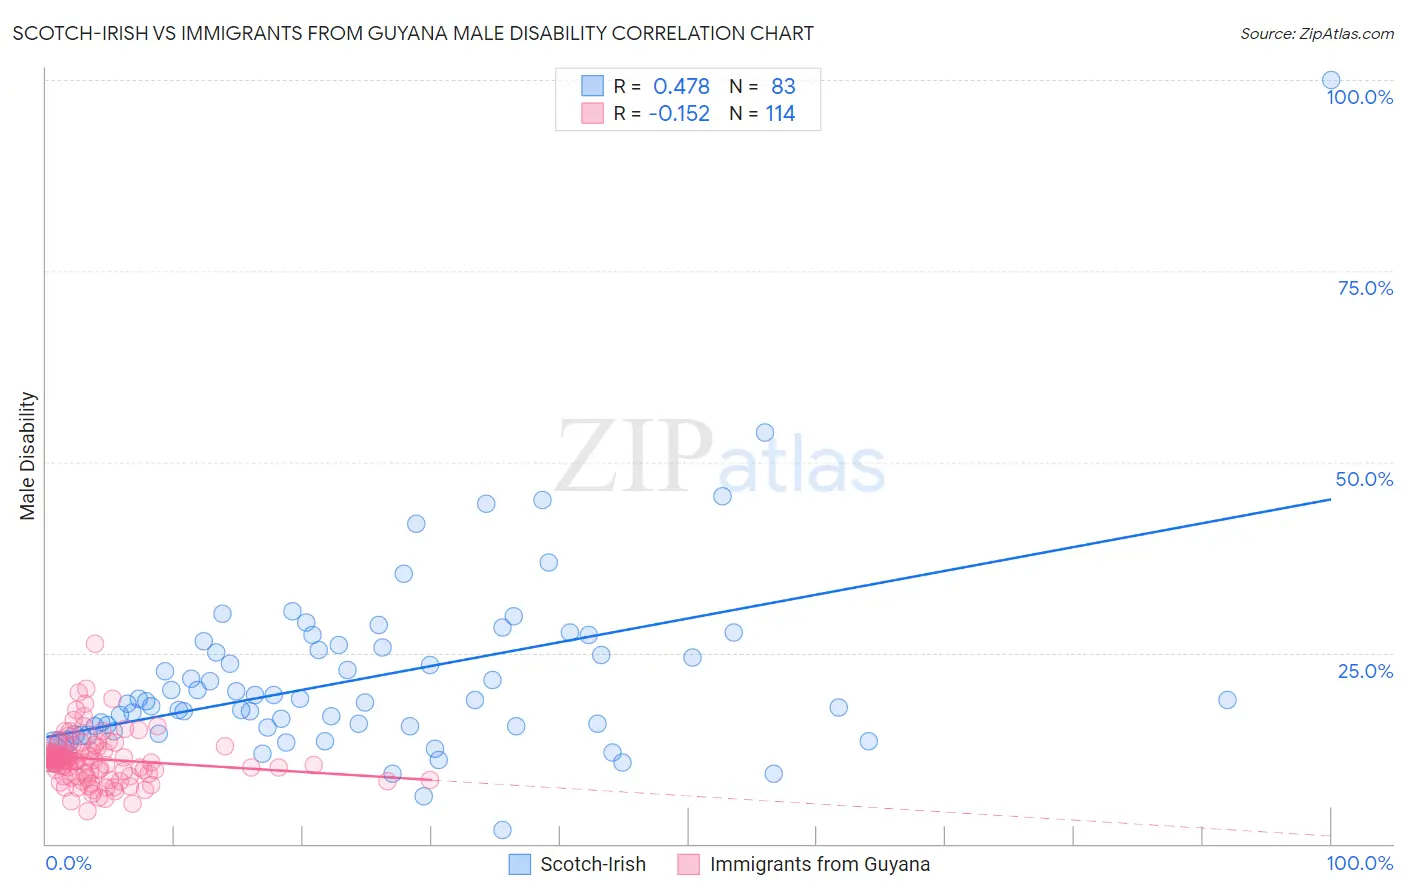
Scotch-Irish vs Immigrants from Guyana Male Disability Correlation Chart
The statistical analysis conducted on geographies consisting of 548,574,277 people shows a moderate positive correlation between the proportion of Scotch-Irish and percentage of males with a disability in the United States with a correlation coefficient (R) of 0.478 and weighted average of 13.2%. Similarly, the statistical analysis conducted on geographies consisting of 183,704,199 people shows a poor negative correlation between the proportion of Immigrants from Guyana and percentage of males with a disability in the United States with a correlation coefficient (R) of -0.152 and weighted average of 10.6%, a difference of 24.5%.
Male Disability Correlation Summary
| Measurement | Scotch-Irish | Immigrants from Guyana |
| Minimum | 1.8% | 4.3% |
| Maximum | 100.0% | 26.1% |
| Range | 98.2% | 21.9% |
| Mean | 21.6% | 11.1% |
| Median | 18.6% | 10.9% |
| Interquartile 25% (IQ1) | 14.8% | 9.1% |
| Interquartile 75% (IQ3) | 25.6% | 12.1% |
| Interquartile Range (IQR) | 10.9% | 2.9% |
| Standard Deviation (Sample) | 12.6% | 3.3% |
| Standard Deviation (Population) | 12.6% | 3.3% |
Similar Demographics by Male Disability
Demographics Similar to Scotch-Irish by Male Disability
In terms of male disability, the demographic groups most similar to Scotch-Irish are Black/African American (13.2%, a difference of 0.32%), Crow (13.1%, a difference of 0.54%), French Canadian (13.3%, a difference of 0.74%), Spanish American (13.3%, a difference of 0.94%), and French (13.0%, a difference of 1.1%).
| Demographics | Rating | Rank | Male Disability |
| Immigrants | Nonimmigrants | 0.0 /100 | #296 | Tragic 12.9% |
| Inupiat | 0.0 /100 | #297 | Tragic 13.0% |
| Pennsylvania Germans | 0.0 /100 | #298 | Tragic 13.0% |
| Celtics | 0.0 /100 | #299 | Tragic 13.0% |
| Cheyenne | 0.0 /100 | #300 | Tragic 13.0% |
| French | 0.0 /100 | #301 | Tragic 13.0% |
| Crow | 0.0 /100 | #302 | Tragic 13.1% |
| Scotch-Irish | 0.0 /100 | #303 | Tragic 13.2% |
| Blacks/African Americans | 0.0 /100 | #304 | Tragic 13.2% |
| French Canadians | 0.0 /100 | #305 | Tragic 13.3% |
| Spanish Americans | 0.0 /100 | #306 | Tragic 13.3% |
| Arapaho | 0.0 /100 | #307 | Tragic 13.3% |
| French American Indians | 0.0 /100 | #308 | Tragic 13.4% |
| Blackfeet | 0.0 /100 | #309 | Tragic 13.4% |
| Immigrants | Azores | 0.0 /100 | #310 | Tragic 13.4% |
Demographics Similar to Immigrants from Guyana by Male Disability
In terms of male disability, the demographic groups most similar to Immigrants from Guyana are Immigrants from Poland (10.6%, a difference of 0.060%), Immigrants from Chile (10.6%, a difference of 0.070%), Bulgarian (10.6%, a difference of 0.080%), Immigrants from Jordan (10.6%, a difference of 0.13%), and Zimbabwean (10.6%, a difference of 0.15%).
| Demographics | Rating | Rank | Male Disability |
| Sierra Leoneans | 98.7 /100 | #75 | Exceptional 10.5% |
| Immigrants | Sierra Leone | 98.7 /100 | #76 | Exceptional 10.5% |
| Laotians | 98.6 /100 | #77 | Exceptional 10.6% |
| Immigrants | Russia | 98.6 /100 | #78 | Exceptional 10.6% |
| Zimbabweans | 98.4 /100 | #79 | Exceptional 10.6% |
| Immigrants | Jordan | 98.4 /100 | #80 | Exceptional 10.6% |
| Immigrants | Chile | 98.3 /100 | #81 | Exceptional 10.6% |
| Immigrants | Guyana | 98.2 /100 | #82 | Exceptional 10.6% |
| Immigrants | Poland | 98.1 /100 | #83 | Exceptional 10.6% |
| Bulgarians | 98.1 /100 | #84 | Exceptional 10.6% |
| Sri Lankans | 97.9 /100 | #85 | Exceptional 10.6% |
| Immigrants | Ireland | 97.9 /100 | #86 | Exceptional 10.6% |
| Immigrants | Vietnam | 97.9 /100 | #87 | Exceptional 10.6% |
| Immigrants | Western Asia | 97.8 /100 | #88 | Exceptional 10.6% |
| Immigrants | Nicaragua | 97.8 /100 | #89 | Exceptional 10.6% |