Okinawan vs Swiss Male Disability
COMPARE
Okinawan
Swiss
Male Disability
Male Disability Comparison
Okinawans
Swiss
9.8%
MALE DISABILITY
100.0/ 100
METRIC RATING
16th/ 347
METRIC RANK
12.1%
MALE DISABILITY
0.3/ 100
METRIC RATING
256th/ 347
METRIC RANK
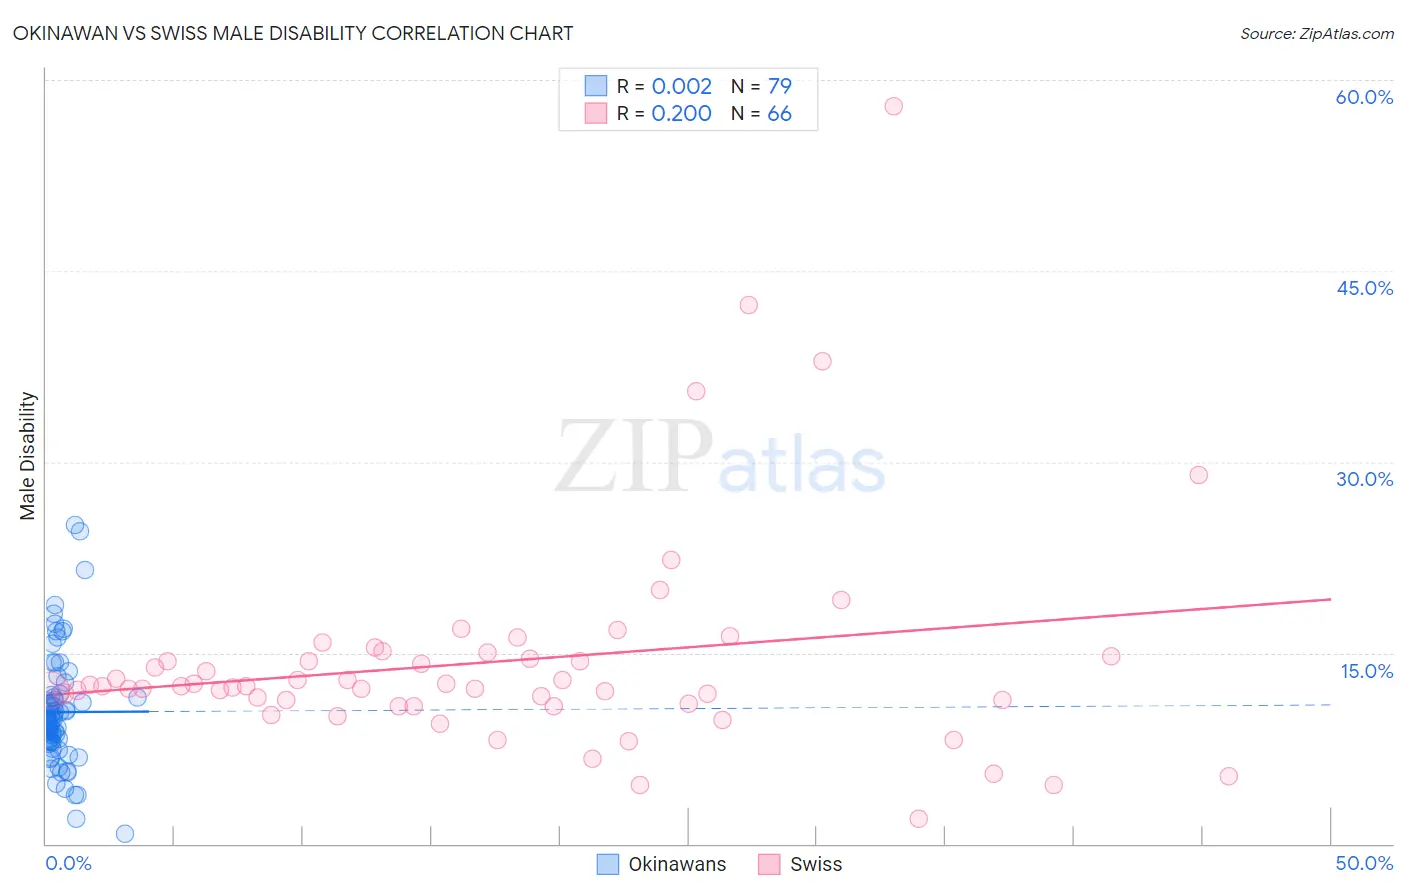
Okinawan vs Swiss Male Disability Correlation Chart
The statistical analysis conducted on geographies consisting of 73,770,513 people shows no correlation between the proportion of Okinawans and percentage of males with a disability in the United States with a correlation coefficient (R) of 0.002 and weighted average of 9.8%. Similarly, the statistical analysis conducted on geographies consisting of 464,975,169 people shows a weak positive correlation between the proportion of Swiss and percentage of males with a disability in the United States with a correlation coefficient (R) of 0.200 and weighted average of 12.1%, a difference of 23.7%.
Male Disability Correlation Summary
| Measurement | Okinawan | Swiss |
| Minimum | 0.75% | 2.0% |
| Maximum | 25.0% | 57.9% |
| Range | 24.2% | 55.9% |
| Mean | 10.3% | 14.3% |
| Median | 9.7% | 12.4% |
| Interquartile 25% (IQ1) | 8.0% | 11.0% |
| Interquartile 75% (IQ3) | 11.5% | 14.7% |
| Interquartile Range (IQR) | 3.5% | 3.7% |
| Standard Deviation (Sample) | 4.4% | 8.7% |
| Standard Deviation (Population) | 4.4% | 8.7% |
Similar Demographics by Male Disability
Demographics Similar to Okinawans by Male Disability
In terms of male disability, the demographic groups most similar to Okinawans are Immigrants from Korea (9.8%, a difference of 0.14%), Indian (Asian) (9.7%, a difference of 0.61%), Immigrants from Pakistan (9.8%, a difference of 0.70%), Immigrants from Iran (9.7%, a difference of 1.1%), and Iranian (9.7%, a difference of 1.2%).
| Demographics | Rating | Rank | Male Disability |
| Immigrants | Singapore | 100.0 /100 | #9 | Exceptional 9.5% |
| Immigrants | Israel | 100.0 /100 | #10 | Exceptional 9.6% |
| Immigrants | Eastern Asia | 100.0 /100 | #11 | Exceptional 9.6% |
| Bolivians | 100.0 /100 | #12 | Exceptional 9.6% |
| Iranians | 100.0 /100 | #13 | Exceptional 9.7% |
| Immigrants | Iran | 100.0 /100 | #14 | Exceptional 9.7% |
| Indians (Asian) | 100.0 /100 | #15 | Exceptional 9.7% |
| Okinawans | 100.0 /100 | #16 | Exceptional 9.8% |
| Immigrants | Korea | 100.0 /100 | #17 | Exceptional 9.8% |
| Immigrants | Pakistan | 100.0 /100 | #18 | Exceptional 9.8% |
| Immigrants | Sri Lanka | 100.0 /100 | #19 | Exceptional 10.0% |
| Asians | 100.0 /100 | #20 | Exceptional 10.0% |
| Burmese | 100.0 /100 | #21 | Exceptional 10.0% |
| Immigrants | Venezuela | 100.0 /100 | #22 | Exceptional 10.0% |
| Cypriots | 100.0 /100 | #23 | Exceptional 10.0% |
Demographics Similar to Swiss by Male Disability
In terms of male disability, the demographic groups most similar to Swiss are European (12.1%, a difference of 0.0%), Basque (12.1%, a difference of 0.19%), Belgian (12.1%, a difference of 0.24%), Chinese (12.1%, a difference of 0.25%), and British (12.1%, a difference of 0.26%).
| Demographics | Rating | Rank | Male Disability |
| Immigrants | Yemen | 0.5 /100 | #249 | Tragic 12.0% |
| Bangladeshis | 0.5 /100 | #250 | Tragic 12.0% |
| German Russians | 0.5 /100 | #251 | Tragic 12.0% |
| Slovenes | 0.5 /100 | #252 | Tragic 12.0% |
| Guamanians/Chamorros | 0.5 /100 | #253 | Tragic 12.0% |
| British | 0.4 /100 | #254 | Tragic 12.1% |
| Chinese | 0.4 /100 | #255 | Tragic 12.1% |
| Swiss | 0.3 /100 | #256 | Tragic 12.1% |
| Europeans | 0.3 /100 | #257 | Tragic 12.1% |
| Basques | 0.3 /100 | #258 | Tragic 12.1% |
| Belgians | 0.3 /100 | #259 | Tragic 12.1% |
| Swedes | 0.3 /100 | #260 | Tragic 12.1% |
| Slavs | 0.2 /100 | #261 | Tragic 12.2% |
| Norwegians | 0.2 /100 | #262 | Tragic 12.2% |
| Canadians | 0.2 /100 | #263 | Tragic 12.2% |