Eastern European vs Swiss Male Disability
COMPARE
Eastern European
Swiss
Male Disability
Male Disability Comparison
Eastern Europeans
Swiss
10.9%
MALE DISABILITY
90.6/ 100
METRIC RATING
117th/ 347
METRIC RANK
12.1%
MALE DISABILITY
0.3/ 100
METRIC RATING
256th/ 347
METRIC RANK
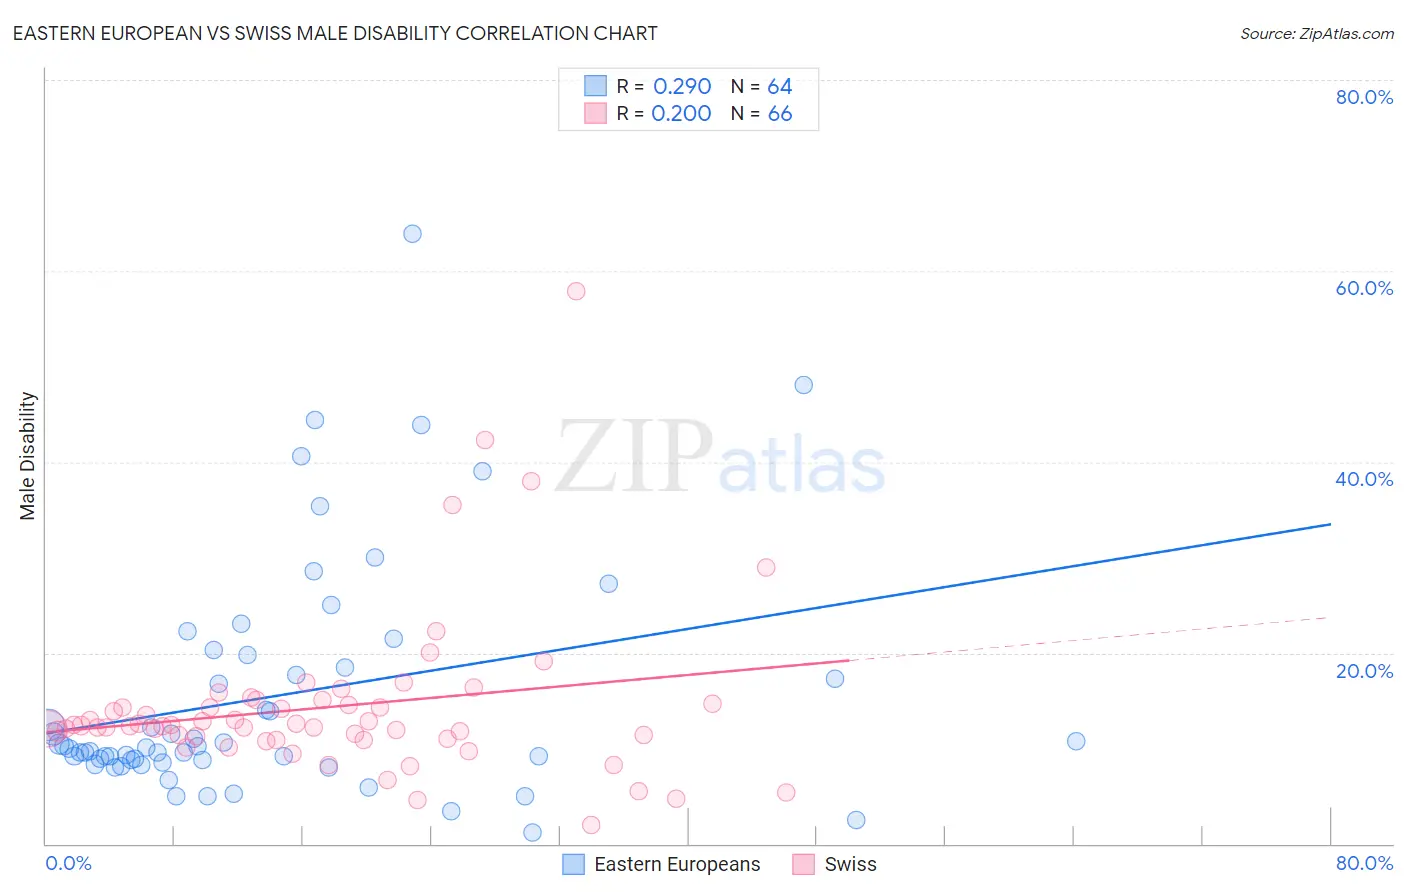
Eastern European vs Swiss Male Disability Correlation Chart
The statistical analysis conducted on geographies consisting of 461,169,070 people shows a weak positive correlation between the proportion of Eastern Europeans and percentage of males with a disability in the United States with a correlation coefficient (R) of 0.290 and weighted average of 10.9%. Similarly, the statistical analysis conducted on geographies consisting of 464,975,169 people shows a weak positive correlation between the proportion of Swiss and percentage of males with a disability in the United States with a correlation coefficient (R) of 0.200 and weighted average of 12.1%, a difference of 11.3%.
Male Disability Correlation Summary
| Measurement | Eastern European | Swiss |
| Minimum | 1.2% | 2.0% |
| Maximum | 63.9% | 57.9% |
| Range | 62.7% | 55.9% |
| Mean | 15.5% | 14.3% |
| Median | 10.1% | 12.4% |
| Interquartile 25% (IQ1) | 8.8% | 11.0% |
| Interquartile 75% (IQ3) | 19.1% | 14.7% |
| Interquartile Range (IQR) | 10.3% | 3.7% |
| Standard Deviation (Sample) | 12.4% | 8.7% |
| Standard Deviation (Population) | 12.3% | 8.7% |
Similar Demographics by Male Disability
Demographics Similar to Eastern Europeans by Male Disability
In terms of male disability, the demographic groups most similar to Eastern Europeans are Immigrants from Cuba (10.9%, a difference of 0.080%), Armenian (10.9%, a difference of 0.080%), Immigrants from Africa (10.9%, a difference of 0.19%), Immigrants from South Africa (10.8%, a difference of 0.21%), and Immigrants from South Eastern Asia (10.9%, a difference of 0.23%).
| Demographics | Rating | Rank | Male Disability |
| Immigrants | Immigrants | 93.9 /100 | #110 | Exceptional 10.8% |
| Immigrants | Uruguay | 93.8 /100 | #111 | Exceptional 10.8% |
| Ghanaians | 93.4 /100 | #112 | Exceptional 10.8% |
| Immigrants | Zimbabwe | 93.0 /100 | #113 | Exceptional 10.8% |
| Central Americans | 92.7 /100 | #114 | Exceptional 10.8% |
| Immigrants | Barbados | 92.2 /100 | #115 | Exceptional 10.8% |
| Immigrants | South Africa | 91.8 /100 | #116 | Exceptional 10.8% |
| Eastern Europeans | 90.6 /100 | #117 | Exceptional 10.9% |
| Immigrants | Cuba | 90.2 /100 | #118 | Exceptional 10.9% |
| Armenians | 90.1 /100 | #119 | Exceptional 10.9% |
| Immigrants | Africa | 89.4 /100 | #120 | Excellent 10.9% |
| Immigrants | South Eastern Asia | 89.2 /100 | #121 | Excellent 10.9% |
| Immigrants | Ghana | 89.0 /100 | #122 | Excellent 10.9% |
| Immigrants | Czechoslovakia | 88.4 /100 | #123 | Excellent 10.9% |
| South American Indians | 88.1 /100 | #124 | Excellent 10.9% |
Demographics Similar to Swiss by Male Disability
In terms of male disability, the demographic groups most similar to Swiss are European (12.1%, a difference of 0.0%), Basque (12.1%, a difference of 0.19%), Belgian (12.1%, a difference of 0.24%), Chinese (12.1%, a difference of 0.25%), and British (12.1%, a difference of 0.26%).
| Demographics | Rating | Rank | Male Disability |
| Immigrants | Yemen | 0.5 /100 | #249 | Tragic 12.0% |
| Bangladeshis | 0.5 /100 | #250 | Tragic 12.0% |
| German Russians | 0.5 /100 | #251 | Tragic 12.0% |
| Slovenes | 0.5 /100 | #252 | Tragic 12.0% |
| Guamanians/Chamorros | 0.5 /100 | #253 | Tragic 12.0% |
| British | 0.4 /100 | #254 | Tragic 12.1% |
| Chinese | 0.4 /100 | #255 | Tragic 12.1% |
| Swiss | 0.3 /100 | #256 | Tragic 12.1% |
| Europeans | 0.3 /100 | #257 | Tragic 12.1% |
| Basques | 0.3 /100 | #258 | Tragic 12.1% |
| Belgians | 0.3 /100 | #259 | Tragic 12.1% |
| Swedes | 0.3 /100 | #260 | Tragic 12.1% |
| Slavs | 0.2 /100 | #261 | Tragic 12.2% |
| Norwegians | 0.2 /100 | #262 | Tragic 12.2% |
| Canadians | 0.2 /100 | #263 | Tragic 12.2% |