Scotch-Irish vs Immigrants from Uruguay Seniors Poverty Over the Age of 75
COMPARE
Scotch-Irish
Immigrants from Uruguay
Seniors Poverty Over the Age of 75
Seniors Poverty Over the Age of 75 Comparison
Scotch-Irish
Immigrants from Uruguay
10.8%
SENIORS POVERTY OVER THE AGE OF 75
99.6/ 100
METRIC RATING
36th/ 347
METRIC RANK
14.3%
SENIORS POVERTY OVER THE AGE OF 75
0.0/ 100
METRIC RATING
270th/ 347
METRIC RANK
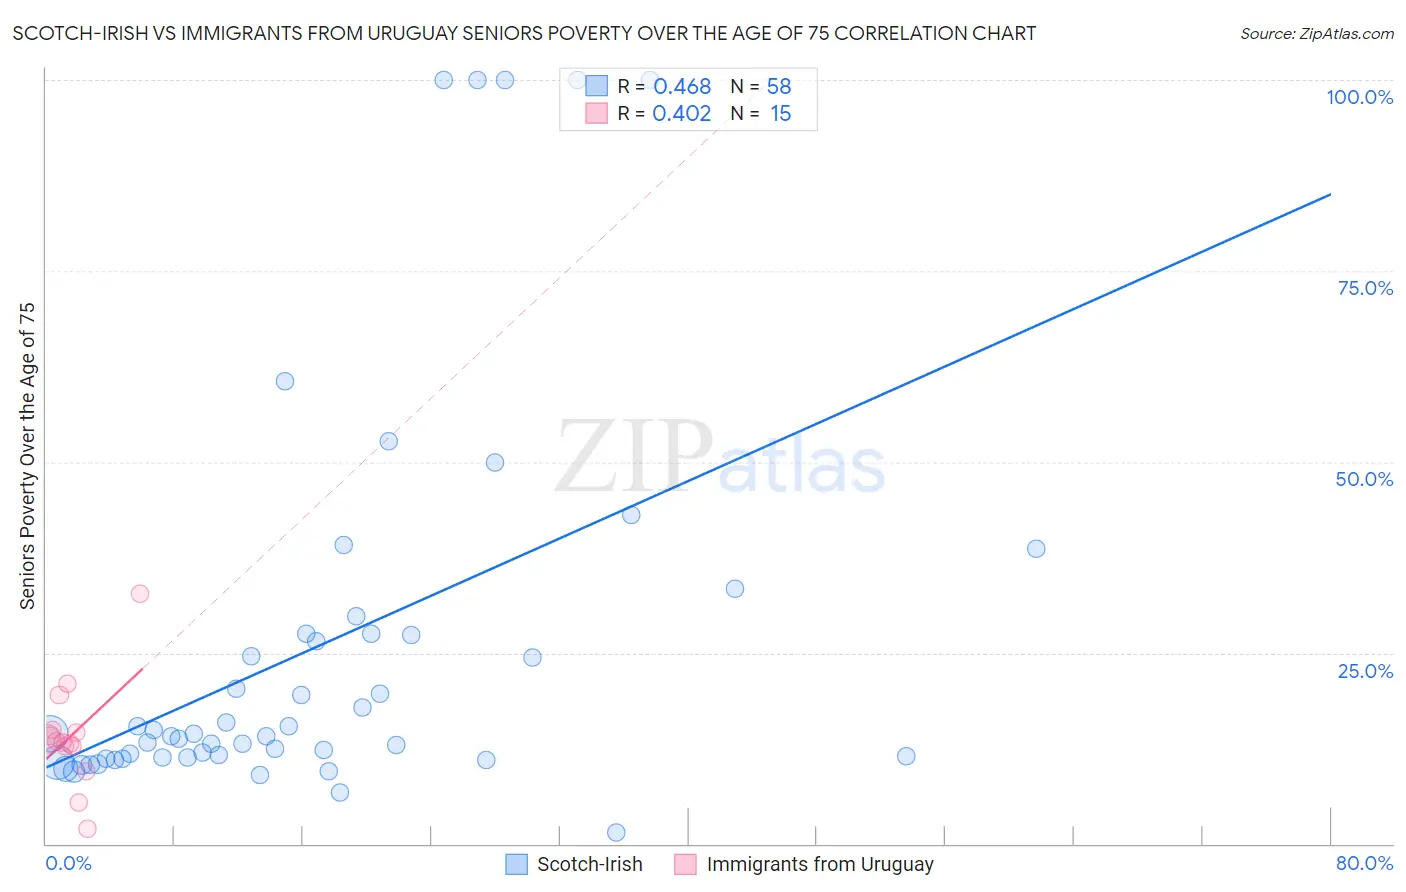
Scotch-Irish vs Immigrants from Uruguay Seniors Poverty Over the Age of 75 Correlation Chart
The statistical analysis conducted on geographies consisting of 534,526,562 people shows a moderate positive correlation between the proportion of Scotch-Irish and poverty level among seniors over the age of 75 in the United States with a correlation coefficient (R) of 0.468 and weighted average of 10.8%. Similarly, the statistical analysis conducted on geographies consisting of 132,859,221 people shows a moderate positive correlation between the proportion of Immigrants from Uruguay and poverty level among seniors over the age of 75 in the United States with a correlation coefficient (R) of 0.402 and weighted average of 14.3%, a difference of 32.3%.
Seniors Poverty Over the Age of 75 Correlation Summary
| Measurement | Scotch-Irish | Immigrants from Uruguay |
| Minimum | 1.4% | 2.0% |
| Maximum | 100.0% | 32.8% |
| Range | 98.6% | 30.8% |
| Mean | 25.7% | 14.2% |
| Median | 14.2% | 13.4% |
| Interquartile 25% (IQ1) | 11.2% | 12.8% |
| Interquartile 75% (IQ3) | 27.4% | 15.0% |
| Interquartile Range (IQR) | 16.2% | 2.2% |
| Standard Deviation (Sample) | 25.9% | 7.0% |
| Standard Deviation (Population) | 25.6% | 6.7% |
Similar Demographics by Seniors Poverty Over the Age of 75
Demographics Similar to Scotch-Irish by Seniors Poverty Over the Age of 75
In terms of seniors poverty over the age of 75, the demographic groups most similar to Scotch-Irish are Luxembourger (10.8%, a difference of 0.050%), Latvian (10.8%, a difference of 0.16%), Finnish (10.8%, a difference of 0.30%), Italian (10.8%, a difference of 0.43%), and Puget Sound Salish (10.8%, a difference of 0.49%).
| Demographics | Rating | Rank | Seniors Poverty Over the Age of 75 |
| Assyrians/Chaldeans/Syriacs | 99.8 /100 | #29 | Exceptional 10.7% |
| Swiss | 99.7 /100 | #30 | Exceptional 10.7% |
| Marshallese | 99.7 /100 | #31 | Exceptional 10.7% |
| British | 99.7 /100 | #32 | Exceptional 10.7% |
| Puget Sound Salish | 99.7 /100 | #33 | Exceptional 10.8% |
| Italians | 99.7 /100 | #34 | Exceptional 10.8% |
| Luxembourgers | 99.6 /100 | #35 | Exceptional 10.8% |
| Scotch-Irish | 99.6 /100 | #36 | Exceptional 10.8% |
| Latvians | 99.6 /100 | #37 | Exceptional 10.8% |
| Finns | 99.6 /100 | #38 | Exceptional 10.8% |
| Czechoslovakians | 99.4 /100 | #39 | Exceptional 10.9% |
| Thais | 99.4 /100 | #40 | Exceptional 10.9% |
| Immigrants | Lithuania | 99.2 /100 | #41 | Exceptional 11.0% |
| Austrians | 99.1 /100 | #42 | Exceptional 11.0% |
| Celtics | 99.1 /100 | #43 | Exceptional 11.0% |
Demographics Similar to Immigrants from Uruguay by Seniors Poverty Over the Age of 75
In terms of seniors poverty over the age of 75, the demographic groups most similar to Immigrants from Uruguay are Immigrants from Venezuela (14.3%, a difference of 0.14%), Colombian (14.3%, a difference of 0.25%), Immigrants from Ghana (14.4%, a difference of 0.48%), Venezuelan (14.2%, a difference of 0.59%), and Mexican (14.4%, a difference of 0.59%).
| Demographics | Rating | Rank | Seniors Poverty Over the Age of 75 |
| Iroquois | 0.1 /100 | #263 | Tragic 14.0% |
| South Americans | 0.0 /100 | #264 | Tragic 14.1% |
| Salvadorans | 0.0 /100 | #265 | Tragic 14.2% |
| Armenians | 0.0 /100 | #266 | Tragic 14.2% |
| Venezuelans | 0.0 /100 | #267 | Tragic 14.2% |
| Colombians | 0.0 /100 | #268 | Tragic 14.3% |
| Immigrants | Venezuela | 0.0 /100 | #269 | Tragic 14.3% |
| Immigrants | Uruguay | 0.0 /100 | #270 | Tragic 14.3% |
| Immigrants | Ghana | 0.0 /100 | #271 | Tragic 14.4% |
| Mexicans | 0.0 /100 | #272 | Tragic 14.4% |
| Immigrants | South America | 0.0 /100 | #273 | Tragic 14.4% |
| Immigrants | Bahamas | 0.0 /100 | #274 | Tragic 14.4% |
| Immigrants | El Salvador | 0.0 /100 | #275 | Tragic 14.5% |
| Soviet Union | 0.0 /100 | #276 | Tragic 14.5% |
| Senegalese | 0.0 /100 | #277 | Tragic 14.5% |