Arab vs Immigrants from Uruguay Vision Disability
COMPARE
Arab
Immigrants from Uruguay
Vision Disability
Vision Disability Comparison
Arabs
Immigrants from Uruguay
2.1%
VISION DISABILITY
86.3/ 100
METRIC RATING
138th/ 347
METRIC RANK
2.2%
VISION DISABILITY
11.5/ 100
METRIC RATING
210th/ 347
METRIC RANK
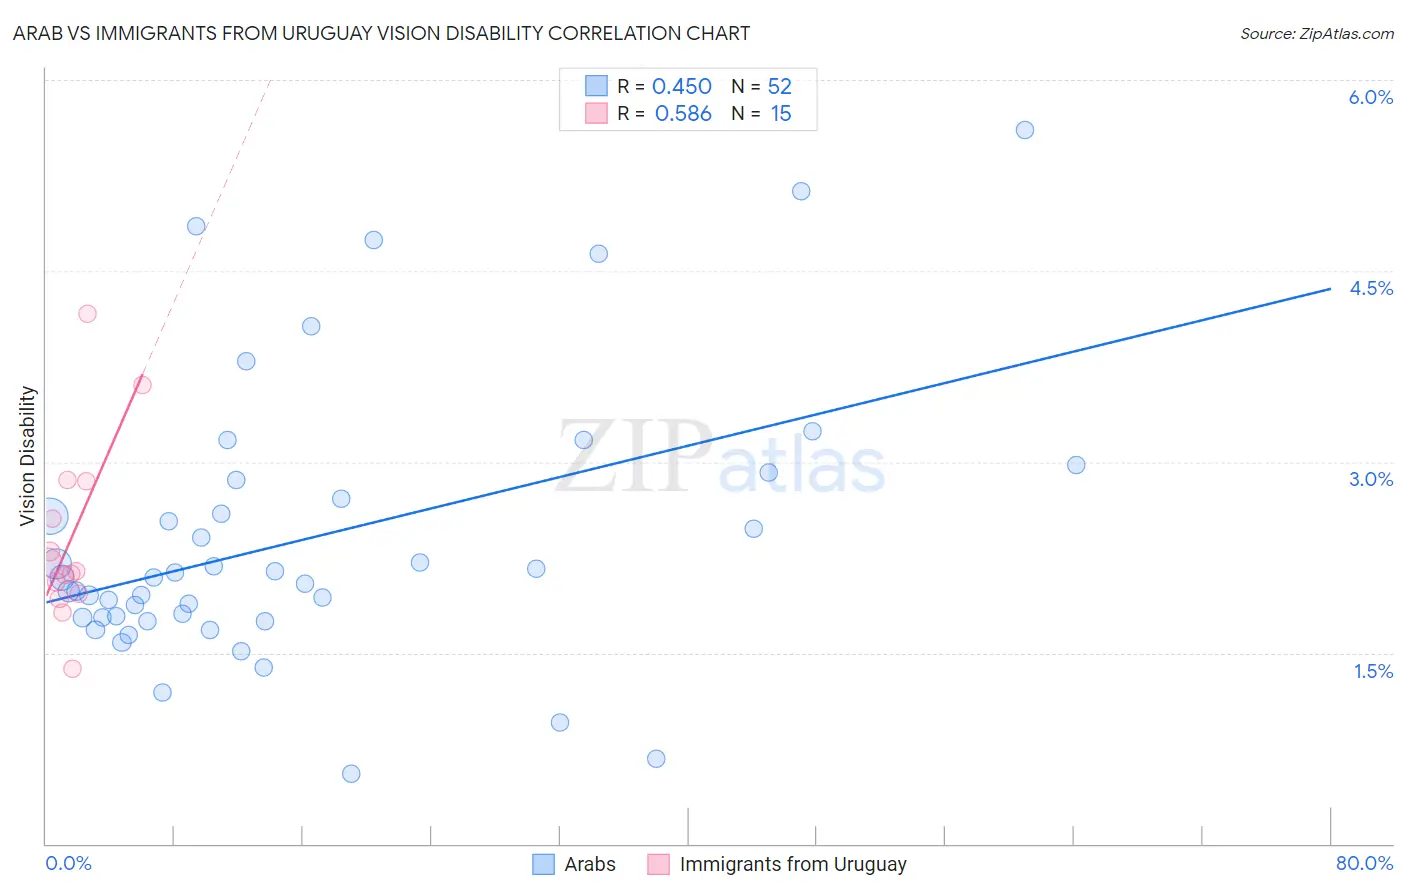
Arab vs Immigrants from Uruguay Vision Disability Correlation Chart
The statistical analysis conducted on geographies consisting of 486,276,128 people shows a moderate positive correlation between the proportion of Arabs and percentage of population with vision disability in the United States with a correlation coefficient (R) of 0.450 and weighted average of 2.1%. Similarly, the statistical analysis conducted on geographies consisting of 133,246,833 people shows a substantial positive correlation between the proportion of Immigrants from Uruguay and percentage of population with vision disability in the United States with a correlation coefficient (R) of 0.586 and weighted average of 2.2%, a difference of 6.3%.
Vision Disability Correlation Summary
| Measurement | Arab | Immigrants from Uruguay |
| Minimum | 0.55% | 1.4% |
| Maximum | 5.6% | 4.2% |
| Range | 5.1% | 2.8% |
| Mean | 2.4% | 2.4% |
| Median | 2.1% | 2.1% |
| Interquartile 25% (IQ1) | 1.8% | 2.0% |
| Interquartile 75% (IQ3) | 2.8% | 2.8% |
| Interquartile Range (IQR) | 1.0% | 0.89% |
| Standard Deviation (Sample) | 1.1% | 0.72% |
| Standard Deviation (Population) | 1.1% | 0.69% |
Similar Demographics by Vision Disability
Demographics Similar to Arabs by Vision Disability
In terms of vision disability, the demographic groups most similar to Arabs are Czech (2.1%, a difference of 0.010%), Immigrants from South Eastern Asia (2.1%, a difference of 0.010%), Vietnamese (2.1%, a difference of 0.060%), Venezuelan (2.1%, a difference of 0.13%), and Immigrants from Morocco (2.1%, a difference of 0.14%).
| Demographics | Rating | Rank | Vision Disability |
| Immigrants | Hungary | 88.7 /100 | #131 | Excellent 2.1% |
| New Zealanders | 88.2 /100 | #132 | Excellent 2.1% |
| Syrians | 87.5 /100 | #133 | Excellent 2.1% |
| Venezuelans | 87.2 /100 | #134 | Excellent 2.1% |
| Vietnamese | 86.7 /100 | #135 | Excellent 2.1% |
| Czechs | 86.3 /100 | #136 | Excellent 2.1% |
| Immigrants | South Eastern Asia | 86.3 /100 | #137 | Excellent 2.1% |
| Arabs | 86.3 /100 | #138 | Excellent 2.1% |
| Immigrants | Morocco | 85.2 /100 | #139 | Excellent 2.1% |
| Immigrants | Netherlands | 84.2 /100 | #140 | Excellent 2.1% |
| Sierra Leoneans | 84.1 /100 | #141 | Excellent 2.1% |
| South Americans | 82.8 /100 | #142 | Excellent 2.1% |
| Immigrants | Sierra Leone | 82.8 /100 | #143 | Excellent 2.1% |
| Ukrainians | 81.9 /100 | #144 | Excellent 2.1% |
| Immigrants | Bosnia and Herzegovina | 81.5 /100 | #145 | Excellent 2.1% |
Demographics Similar to Immigrants from Uruguay by Vision Disability
In terms of vision disability, the demographic groups most similar to Immigrants from Uruguay are Immigrants from Brazil (2.2%, a difference of 0.23%), Immigrants from Nigeria (2.2%, a difference of 0.27%), German (2.2%, a difference of 0.27%), Indonesian (2.2%, a difference of 0.34%), and Pennsylvania German (2.2%, a difference of 0.41%).
| Demographics | Rating | Rank | Vision Disability |
| Dutch | 17.1 /100 | #203 | Poor 2.2% |
| Immigrants | Guyana | 15.9 /100 | #204 | Poor 2.2% |
| Samoans | 15.7 /100 | #205 | Poor 2.2% |
| Pennsylvania Germans | 14.5 /100 | #206 | Poor 2.2% |
| Immigrants | Nigeria | 13.5 /100 | #207 | Poor 2.2% |
| Germans | 13.4 /100 | #208 | Poor 2.2% |
| Immigrants | Brazil | 13.1 /100 | #209 | Poor 2.2% |
| Immigrants | Uruguay | 11.5 /100 | #210 | Poor 2.2% |
| Indonesians | 9.5 /100 | #211 | Tragic 2.2% |
| Bermudans | 9.0 /100 | #212 | Tragic 2.2% |
| Immigrants | Ghana | 8.9 /100 | #213 | Tragic 2.2% |
| Trinidadians and Tobagonians | 8.2 /100 | #214 | Tragic 2.2% |
| Nigerians | 7.2 /100 | #215 | Tragic 2.3% |
| Immigrants | Trinidad and Tobago | 6.1 /100 | #216 | Tragic 2.3% |
| Barbadians | 5.1 /100 | #217 | Tragic 2.3% |