Paiute vs Immigrants from Uruguay Vision Disability
COMPARE
Paiute
Immigrants from Uruguay
Vision Disability
Vision Disability Comparison
Paiute
Immigrants from Uruguay
2.9%
VISION DISABILITY
0.0/ 100
METRIC RATING
322nd/ 347
METRIC RANK
2.2%
VISION DISABILITY
11.5/ 100
METRIC RATING
210th/ 347
METRIC RANK
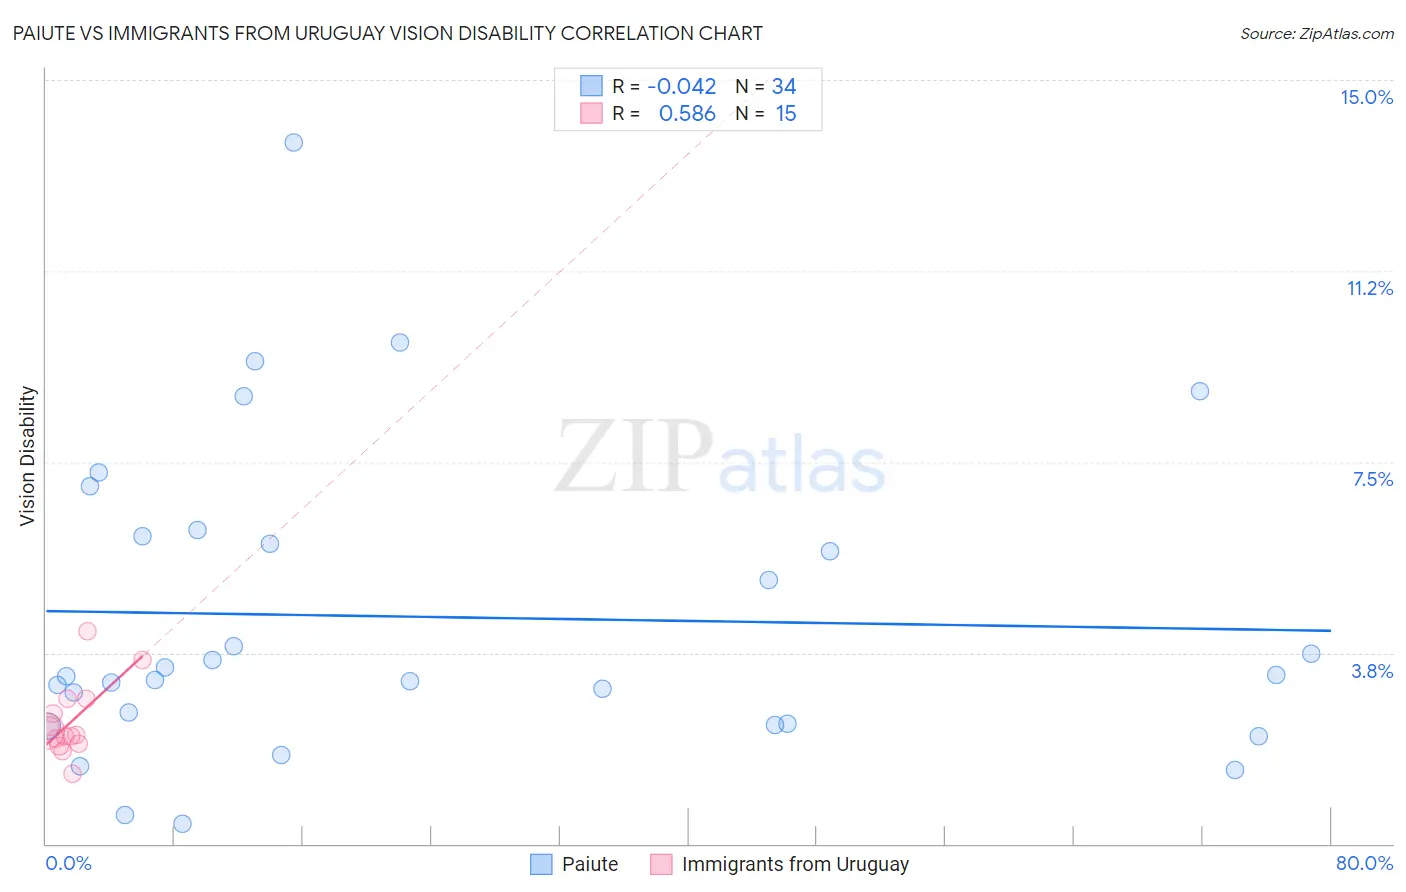
Paiute vs Immigrants from Uruguay Vision Disability Correlation Chart
The statistical analysis conducted on geographies consisting of 58,384,009 people shows no correlation between the proportion of Paiute and percentage of population with vision disability in the United States with a correlation coefficient (R) of -0.042 and weighted average of 2.9%. Similarly, the statistical analysis conducted on geographies consisting of 133,246,833 people shows a substantial positive correlation between the proportion of Immigrants from Uruguay and percentage of population with vision disability in the United States with a correlation coefficient (R) of 0.586 and weighted average of 2.2%, a difference of 27.7%.
Vision Disability Correlation Summary
| Measurement | Paiute | Immigrants from Uruguay |
| Minimum | 0.39% | 1.4% |
| Maximum | 13.8% | 4.2% |
| Range | 13.4% | 2.8% |
| Mean | 4.5% | 2.4% |
| Median | 3.3% | 2.1% |
| Interquartile 25% (IQ1) | 2.4% | 2.0% |
| Interquartile 75% (IQ3) | 6.0% | 2.8% |
| Interquartile Range (IQR) | 3.7% | 0.89% |
| Standard Deviation (Sample) | 3.0% | 0.72% |
| Standard Deviation (Population) | 3.0% | 0.69% |
Similar Demographics by Vision Disability
Demographics Similar to Paiute by Vision Disability
In terms of vision disability, the demographic groups most similar to Paiute are Tlingit-Haida (2.9%, a difference of 0.0%), Comanche (2.8%, a difference of 0.42%), Hopi (2.9%, a difference of 2.0%), Cherokee (2.9%, a difference of 2.0%), and Black/African American (2.8%, a difference of 2.5%).
| Demographics | Rating | Rank | Vision Disability |
| Osage | 0.0 /100 | #315 | Tragic 2.7% |
| Shoshone | 0.0 /100 | #316 | Tragic 2.7% |
| Yup'ik | 0.0 /100 | #317 | Tragic 2.7% |
| Alaska Natives | 0.0 /100 | #318 | Tragic 2.7% |
| Tohono O'odham | 0.0 /100 | #319 | Tragic 2.8% |
| Blacks/African Americans | 0.0 /100 | #320 | Tragic 2.8% |
| Comanche | 0.0 /100 | #321 | Tragic 2.8% |
| Paiute | 0.0 /100 | #322 | Tragic 2.9% |
| Tlingit-Haida | 0.0 /100 | #323 | Tragic 2.9% |
| Hopi | 0.0 /100 | #324 | Tragic 2.9% |
| Cherokee | 0.0 /100 | #325 | Tragic 2.9% |
| Spanish Americans | 0.0 /100 | #326 | Tragic 2.9% |
| Natives/Alaskans | 0.0 /100 | #327 | Tragic 3.0% |
| Yuman | 0.0 /100 | #328 | Tragic 3.0% |
| Apache | 0.0 /100 | #329 | Tragic 3.0% |
Demographics Similar to Immigrants from Uruguay by Vision Disability
In terms of vision disability, the demographic groups most similar to Immigrants from Uruguay are Immigrants from Brazil (2.2%, a difference of 0.23%), Immigrants from Nigeria (2.2%, a difference of 0.27%), German (2.2%, a difference of 0.27%), Indonesian (2.2%, a difference of 0.34%), and Pennsylvania German (2.2%, a difference of 0.41%).
| Demographics | Rating | Rank | Vision Disability |
| Dutch | 17.1 /100 | #203 | Poor 2.2% |
| Immigrants | Guyana | 15.9 /100 | #204 | Poor 2.2% |
| Samoans | 15.7 /100 | #205 | Poor 2.2% |
| Pennsylvania Germans | 14.5 /100 | #206 | Poor 2.2% |
| Immigrants | Nigeria | 13.5 /100 | #207 | Poor 2.2% |
| Germans | 13.4 /100 | #208 | Poor 2.2% |
| Immigrants | Brazil | 13.1 /100 | #209 | Poor 2.2% |
| Immigrants | Uruguay | 11.5 /100 | #210 | Poor 2.2% |
| Indonesians | 9.5 /100 | #211 | Tragic 2.2% |
| Bermudans | 9.0 /100 | #212 | Tragic 2.2% |
| Immigrants | Ghana | 8.9 /100 | #213 | Tragic 2.2% |
| Trinidadians and Tobagonians | 8.2 /100 | #214 | Tragic 2.2% |
| Nigerians | 7.2 /100 | #215 | Tragic 2.3% |
| Immigrants | Trinidad and Tobago | 6.1 /100 | #216 | Tragic 2.3% |
| Barbadians | 5.1 /100 | #217 | Tragic 2.3% |