Crow vs Immigrants from Somalia Vision Disability
COMPARE
Crow
Immigrants from Somalia
Vision Disability
Vision Disability Comparison
Crow
Immigrants from Somalia
2.5%
VISION DISABILITY
0.0/ 100
METRIC RATING
292nd/ 347
METRIC RANK
2.1%
VISION DISABILITY
96.2/ 100
METRIC RATING
91st/ 347
METRIC RANK
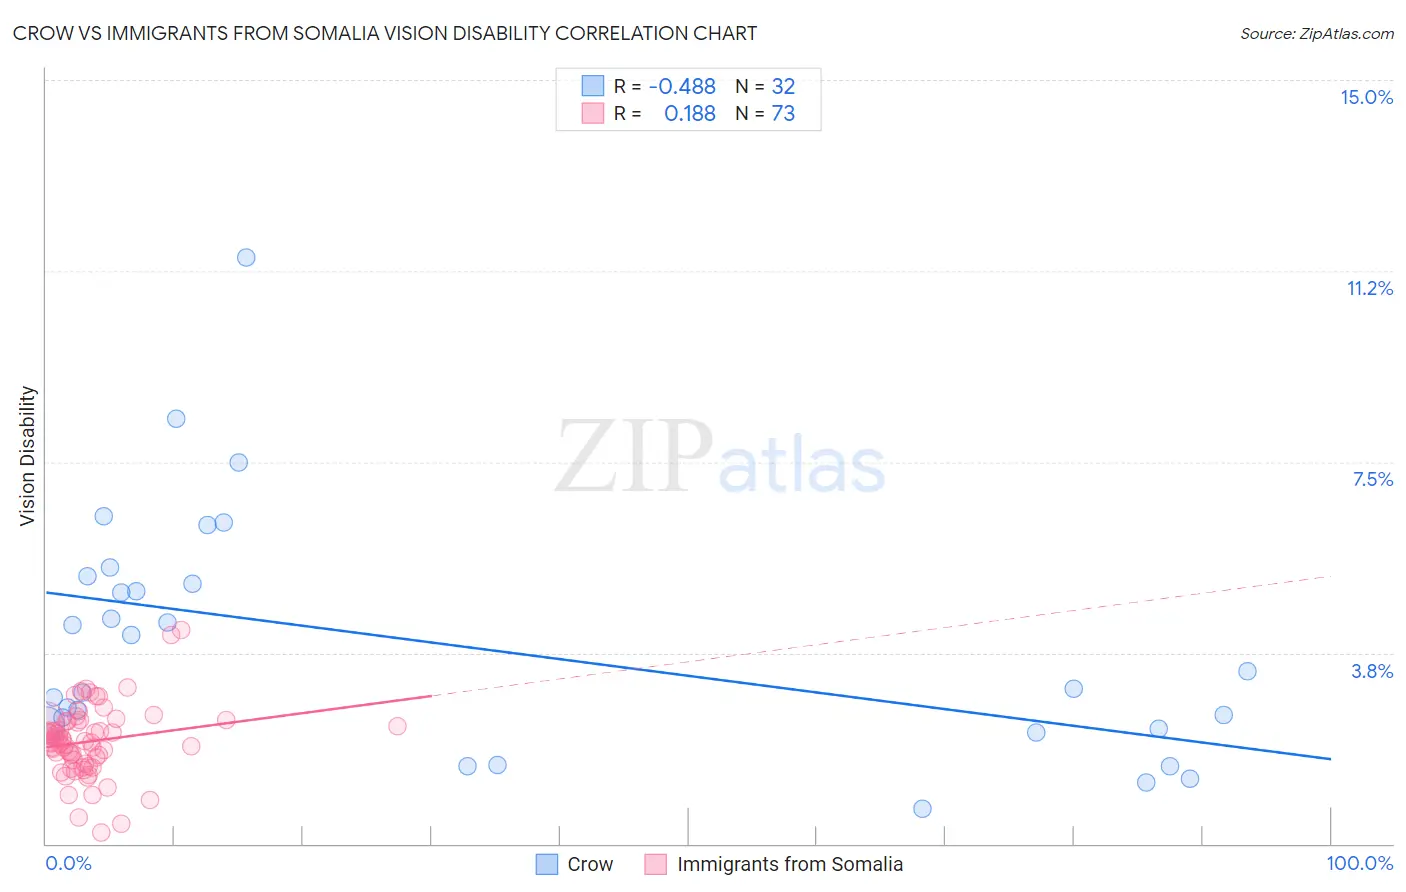
Crow vs Immigrants from Somalia Vision Disability Correlation Chart
The statistical analysis conducted on geographies consisting of 59,186,790 people shows a moderate negative correlation between the proportion of Crow and percentage of population with vision disability in the United States with a correlation coefficient (R) of -0.488 and weighted average of 2.5%. Similarly, the statistical analysis conducted on geographies consisting of 92,068,110 people shows a poor positive correlation between the proportion of Immigrants from Somalia and percentage of population with vision disability in the United States with a correlation coefficient (R) of 0.188 and weighted average of 2.1%, a difference of 21.4%.
Vision Disability Correlation Summary
| Measurement | Crow | Immigrants from Somalia |
| Minimum | 0.69% | 0.23% |
| Maximum | 11.5% | 4.2% |
| Range | 10.8% | 4.0% |
| Mean | 3.9% | 2.0% |
| Median | 3.2% | 2.0% |
| Interquartile 25% (IQ1) | 2.3% | 1.6% |
| Interquartile 75% (IQ3) | 5.2% | 2.4% |
| Interquartile Range (IQR) | 2.9% | 0.80% |
| Standard Deviation (Sample) | 2.4% | 0.70% |
| Standard Deviation (Population) | 2.3% | 0.69% |
Similar Demographics by Vision Disability
Demographics Similar to Crow by Vision Disability
In terms of vision disability, the demographic groups most similar to Crow are Yaqui (2.5%, a difference of 0.030%), Immigrants from Honduras (2.5%, a difference of 0.10%), Ottawa (2.5%, a difference of 0.36%), Immigrants from Cuba (2.5%, a difference of 0.49%), and Delaware (2.5%, a difference of 0.58%).
| Demographics | Rating | Rank | Vision Disability |
| Immigrants | Central America | 0.0 /100 | #285 | Tragic 2.5% |
| Sioux | 0.0 /100 | #286 | Tragic 2.5% |
| Hondurans | 0.0 /100 | #287 | Tragic 2.5% |
| French American Indians | 0.0 /100 | #288 | Tragic 2.5% |
| Immigrants | Nonimmigrants | 0.0 /100 | #289 | Tragic 2.5% |
| Immigrants | Cuba | 0.0 /100 | #290 | Tragic 2.5% |
| Immigrants | Honduras | 0.0 /100 | #291 | Tragic 2.5% |
| Crow | 0.0 /100 | #292 | Tragic 2.5% |
| Yaqui | 0.0 /100 | #293 | Tragic 2.5% |
| Ottawa | 0.0 /100 | #294 | Tragic 2.5% |
| Delaware | 0.0 /100 | #295 | Tragic 2.5% |
| Immigrants | Mexico | 0.0 /100 | #296 | Tragic 2.5% |
| Immigrants | Dominica | 0.0 /100 | #297 | Tragic 2.5% |
| Mexicans | 0.0 /100 | #298 | Tragic 2.5% |
| Cree | 0.0 /100 | #299 | Tragic 2.5% |
Demographics Similar to Immigrants from Somalia by Vision Disability
In terms of vision disability, the demographic groups most similar to Immigrants from Somalia are Immigrants from Syria (2.1%, a difference of 0.020%), Immigrants from Europe (2.1%, a difference of 0.060%), Immigrants from Croatia (2.1%, a difference of 0.090%), Australian (2.1%, a difference of 0.16%), and Romanian (2.1%, a difference of 0.22%).
| Demographics | Rating | Rank | Vision Disability |
| Immigrants | Latvia | 97.3 /100 | #84 | Exceptional 2.0% |
| Chinese | 97.2 /100 | #85 | Exceptional 2.0% |
| Immigrants | Moldova | 97.2 /100 | #86 | Exceptional 2.0% |
| Immigrants | Switzerland | 97.0 /100 | #87 | Exceptional 2.0% |
| Norwegians | 97.0 /100 | #88 | Exceptional 2.0% |
| Immigrants | Eastern Africa | 97.0 /100 | #89 | Exceptional 2.0% |
| Immigrants | Lebanon | 96.7 /100 | #90 | Exceptional 2.1% |
| Immigrants | Somalia | 96.2 /100 | #91 | Exceptional 2.1% |
| Immigrants | Syria | 96.2 /100 | #92 | Exceptional 2.1% |
| Immigrants | Europe | 96.1 /100 | #93 | Exceptional 2.1% |
| Immigrants | Croatia | 96.0 /100 | #94 | Exceptional 2.1% |
| Australians | 95.9 /100 | #95 | Exceptional 2.1% |
| Romanians | 95.7 /100 | #96 | Exceptional 2.1% |
| Immigrants | Afghanistan | 95.6 /100 | #97 | Exceptional 2.1% |
| Immigrants | South Africa | 95.4 /100 | #98 | Exceptional 2.1% |