Central American Indian vs Immigrants from Somalia Vision Disability
COMPARE
Central American Indian
Immigrants from Somalia
Vision Disability
Vision Disability Comparison
Central American Indians
Immigrants from Somalia
3.0%
VISION DISABILITY
0.0/ 100
METRIC RATING
331st/ 347
METRIC RANK
2.1%
VISION DISABILITY
96.2/ 100
METRIC RATING
91st/ 347
METRIC RANK
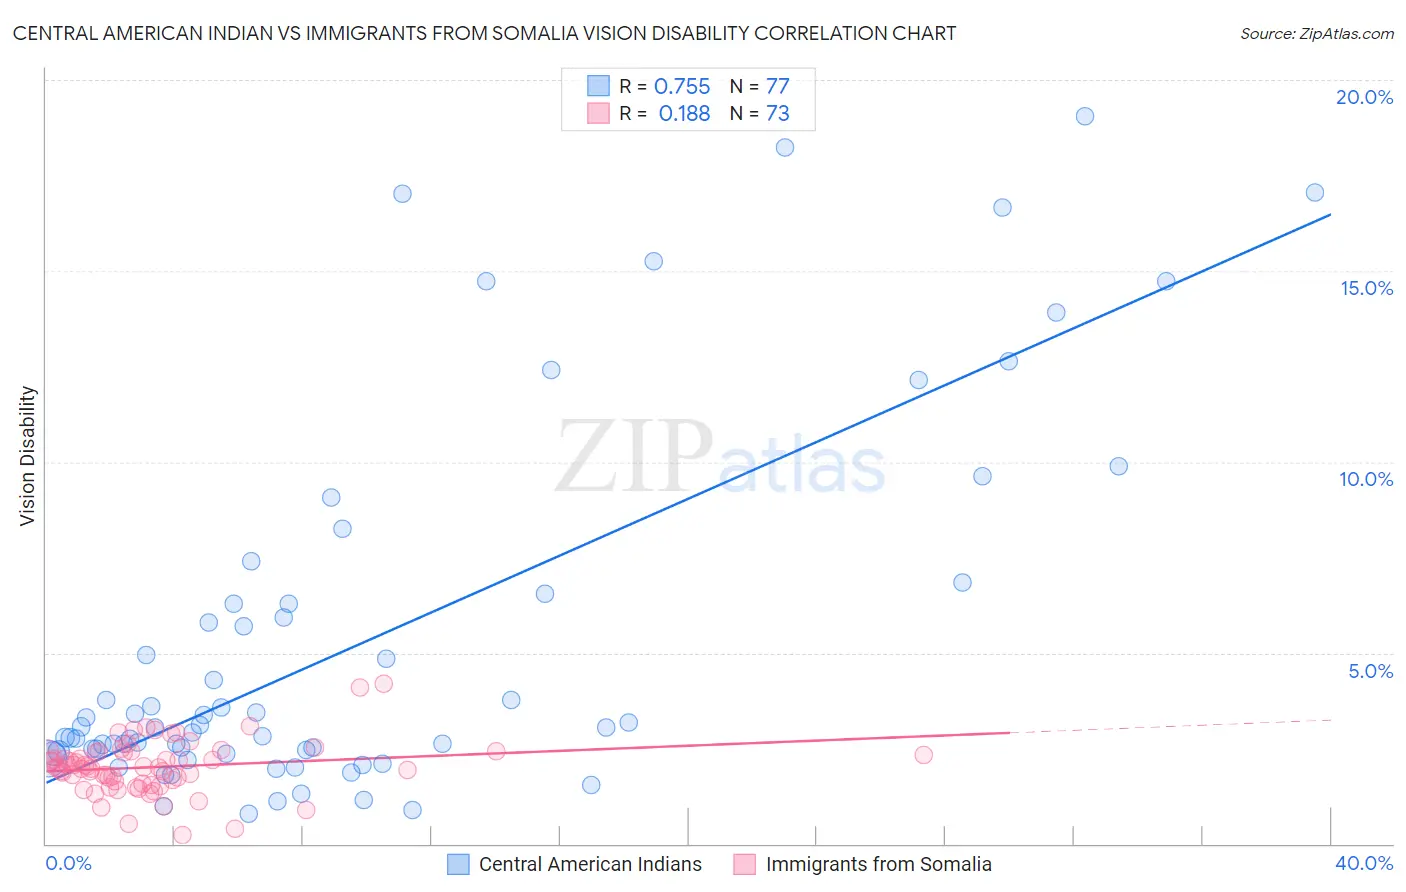
Central American Indian vs Immigrants from Somalia Vision Disability Correlation Chart
The statistical analysis conducted on geographies consisting of 326,060,213 people shows a strong positive correlation between the proportion of Central American Indians and percentage of population with vision disability in the United States with a correlation coefficient (R) of 0.755 and weighted average of 3.0%. Similarly, the statistical analysis conducted on geographies consisting of 92,068,110 people shows a poor positive correlation between the proportion of Immigrants from Somalia and percentage of population with vision disability in the United States with a correlation coefficient (R) of 0.188 and weighted average of 2.1%, a difference of 48.2%.
Vision Disability Correlation Summary
| Measurement | Central American Indian | Immigrants from Somalia |
| Minimum | 0.79% | 0.23% |
| Maximum | 19.1% | 4.2% |
| Range | 18.3% | 4.0% |
| Mean | 5.3% | 2.0% |
| Median | 3.0% | 2.0% |
| Interquartile 25% (IQ1) | 2.4% | 1.6% |
| Interquartile 75% (IQ3) | 6.4% | 2.4% |
| Interquartile Range (IQR) | 4.0% | 0.80% |
| Standard Deviation (Sample) | 4.8% | 0.70% |
| Standard Deviation (Population) | 4.8% | 0.69% |
Similar Demographics by Vision Disability
Demographics Similar to Central American Indians by Vision Disability
In terms of vision disability, the demographic groups most similar to Central American Indians are Seminole (3.1%, a difference of 0.43%), Cajun (3.1%, a difference of 0.45%), Colville (3.0%, a difference of 0.64%), Cheyenne (3.1%, a difference of 1.5%), and Apache (3.0%, a difference of 1.8%).
| Demographics | Rating | Rank | Vision Disability |
| Hopi | 0.0 /100 | #324 | Tragic 2.9% |
| Cherokee | 0.0 /100 | #325 | Tragic 2.9% |
| Spanish Americans | 0.0 /100 | #326 | Tragic 2.9% |
| Natives/Alaskans | 0.0 /100 | #327 | Tragic 3.0% |
| Yuman | 0.0 /100 | #328 | Tragic 3.0% |
| Apache | 0.0 /100 | #329 | Tragic 3.0% |
| Colville | 0.0 /100 | #330 | Tragic 3.0% |
| Central American Indians | 0.0 /100 | #331 | Tragic 3.0% |
| Seminole | 0.0 /100 | #332 | Tragic 3.1% |
| Cajuns | 0.0 /100 | #333 | Tragic 3.1% |
| Cheyenne | 0.0 /100 | #334 | Tragic 3.1% |
| Navajo | 0.0 /100 | #335 | Tragic 3.1% |
| Alaskan Athabascans | 0.0 /100 | #336 | Tragic 3.1% |
| Dutch West Indians | 0.0 /100 | #337 | Tragic 3.2% |
| Chickasaw | 0.0 /100 | #338 | Tragic 3.2% |
Demographics Similar to Immigrants from Somalia by Vision Disability
In terms of vision disability, the demographic groups most similar to Immigrants from Somalia are Immigrants from Syria (2.1%, a difference of 0.020%), Immigrants from Europe (2.1%, a difference of 0.060%), Immigrants from Croatia (2.1%, a difference of 0.090%), Australian (2.1%, a difference of 0.16%), and Romanian (2.1%, a difference of 0.22%).
| Demographics | Rating | Rank | Vision Disability |
| Immigrants | Latvia | 97.3 /100 | #84 | Exceptional 2.0% |
| Chinese | 97.2 /100 | #85 | Exceptional 2.0% |
| Immigrants | Moldova | 97.2 /100 | #86 | Exceptional 2.0% |
| Immigrants | Switzerland | 97.0 /100 | #87 | Exceptional 2.0% |
| Norwegians | 97.0 /100 | #88 | Exceptional 2.0% |
| Immigrants | Eastern Africa | 97.0 /100 | #89 | Exceptional 2.0% |
| Immigrants | Lebanon | 96.7 /100 | #90 | Exceptional 2.1% |
| Immigrants | Somalia | 96.2 /100 | #91 | Exceptional 2.1% |
| Immigrants | Syria | 96.2 /100 | #92 | Exceptional 2.1% |
| Immigrants | Europe | 96.1 /100 | #93 | Exceptional 2.1% |
| Immigrants | Croatia | 96.0 /100 | #94 | Exceptional 2.1% |
| Australians | 95.9 /100 | #95 | Exceptional 2.1% |
| Romanians | 95.7 /100 | #96 | Exceptional 2.1% |
| Immigrants | Afghanistan | 95.6 /100 | #97 | Exceptional 2.1% |
| Immigrants | South Africa | 95.4 /100 | #98 | Exceptional 2.1% |