Scotch-Irish vs Hawaiian Female Disability
COMPARE
Scotch-Irish
Hawaiian
Female Disability
Female Disability Comparison
Scotch-Irish
Hawaiians
13.4%
FEMALE DISABILITY
0.0/ 100
METRIC RATING
302nd/ 347
METRIC RANK
12.7%
FEMALE DISABILITY
1.4/ 100
METRIC RATING
254th/ 347
METRIC RANK
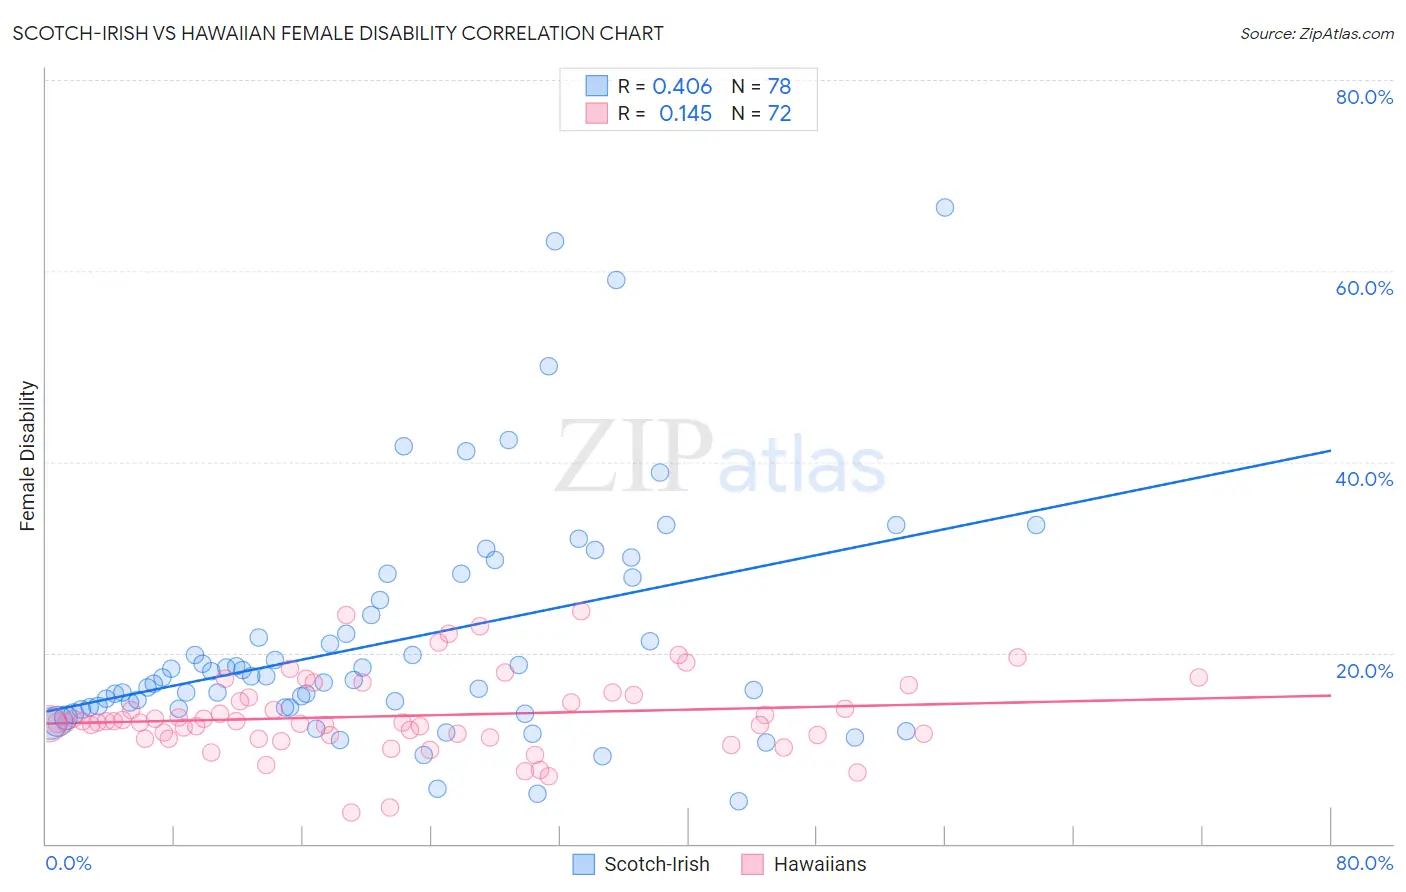
Scotch-Irish vs Hawaiian Female Disability Correlation Chart
The statistical analysis conducted on geographies consisting of 548,573,243 people shows a moderate positive correlation between the proportion of Scotch-Irish and percentage of females with a disability in the United States with a correlation coefficient (R) of 0.406 and weighted average of 13.4%. Similarly, the statistical analysis conducted on geographies consisting of 327,480,697 people shows a poor positive correlation between the proportion of Hawaiians and percentage of females with a disability in the United States with a correlation coefficient (R) of 0.145 and weighted average of 12.7%, a difference of 6.0%.
Female Disability Correlation Summary
| Measurement | Scotch-Irish | Hawaiian |
| Minimum | 4.4% | 3.3% |
| Maximum | 66.7% | 24.3% |
| Range | 62.3% | 21.1% |
| Mean | 21.2% | 13.4% |
| Median | 17.3% | 12.7% |
| Interquartile 25% (IQ1) | 14.2% | 11.3% |
| Interquartile 75% (IQ3) | 25.5% | 15.5% |
| Interquartile Range (IQR) | 11.2% | 4.2% |
| Standard Deviation (Sample) | 12.3% | 4.1% |
| Standard Deviation (Population) | 12.2% | 4.1% |
Similar Demographics by Female Disability
Demographics Similar to Scotch-Irish by Female Disability
In terms of female disability, the demographic groups most similar to Scotch-Irish are Immigrants from Portugal (13.5%, a difference of 0.0%), Immigrants from Micronesia (13.5%, a difference of 0.030%), African (13.4%, a difference of 0.14%), Pennsylvania German (13.4%, a difference of 0.34%), and Immigrants from Dominican Republic (13.4%, a difference of 0.35%).
| Demographics | Rating | Rank | Female Disability |
| French | 0.0 /100 | #295 | Tragic 13.3% |
| Nepalese | 0.0 /100 | #296 | Tragic 13.3% |
| Slovaks | 0.0 /100 | #297 | Tragic 13.3% |
| Immigrants | Nonimmigrants | 0.0 /100 | #298 | Tragic 13.4% |
| Immigrants | Dominican Republic | 0.0 /100 | #299 | Tragic 13.4% |
| Pennsylvania Germans | 0.0 /100 | #300 | Tragic 13.4% |
| Africans | 0.0 /100 | #301 | Tragic 13.4% |
| Scotch-Irish | 0.0 /100 | #302 | Tragic 13.4% |
| Immigrants | Portugal | 0.0 /100 | #303 | Tragic 13.5% |
| Immigrants | Micronesia | 0.0 /100 | #304 | Tragic 13.5% |
| Dominicans | 0.0 /100 | #305 | Tragic 13.5% |
| French Canadians | 0.0 /100 | #306 | Tragic 13.6% |
| Central American Indians | 0.0 /100 | #307 | Tragic 13.6% |
| Cree | 0.0 /100 | #308 | Tragic 13.7% |
| French American Indians | 0.0 /100 | #309 | Tragic 13.7% |
Demographics Similar to Hawaiians by Female Disability
In terms of female disability, the demographic groups most similar to Hawaiians are Jamaican (12.7%, a difference of 0.030%), Immigrants from Caribbean (12.7%, a difference of 0.040%), Immigrants from Germany (12.7%, a difference of 0.080%), Crow (12.7%, a difference of 0.12%), and British West Indian (12.7%, a difference of 0.15%).
| Demographics | Rating | Rank | Female Disability |
| Menominee | 2.1 /100 | #247 | Tragic 12.6% |
| Carpatho Rusyns | 2.0 /100 | #248 | Tragic 12.6% |
| Immigrants | Congo | 1.8 /100 | #249 | Tragic 12.7% |
| Slovenes | 1.7 /100 | #250 | Tragic 12.7% |
| Crow | 1.6 /100 | #251 | Tragic 12.7% |
| Immigrants | Caribbean | 1.4 /100 | #252 | Tragic 12.7% |
| Jamaicans | 1.4 /100 | #253 | Tragic 12.7% |
| Hawaiians | 1.4 /100 | #254 | Tragic 12.7% |
| Immigrants | Germany | 1.3 /100 | #255 | Tragic 12.7% |
| British West Indians | 1.2 /100 | #256 | Tragic 12.7% |
| Liberians | 1.1 /100 | #257 | Tragic 12.7% |
| Aleuts | 1.1 /100 | #258 | Tragic 12.7% |
| Immigrants | Armenia | 1.0 /100 | #259 | Tragic 12.7% |
| Sub-Saharan Africans | 1.0 /100 | #260 | Tragic 12.7% |
| Bermudans | 1.0 /100 | #261 | Tragic 12.7% |