Scotch-Irish vs Hawaiian Unemployment Among Seniors over 65 years
COMPARE
Scotch-Irish
Hawaiian
Unemployment Among Seniors over 65 years
Unemployment Among Seniors over 65 years Comparison
Scotch-Irish
Hawaiians
4.9%
UNEMPLOYMENT AMONG SENIORS OVER 65 YEARS
99.9/ 100
METRIC RATING
51st/ 347
METRIC RANK
5.4%
UNEMPLOYMENT AMONG SENIORS OVER 65 YEARS
0.1/ 100
METRIC RATING
268th/ 347
METRIC RANK
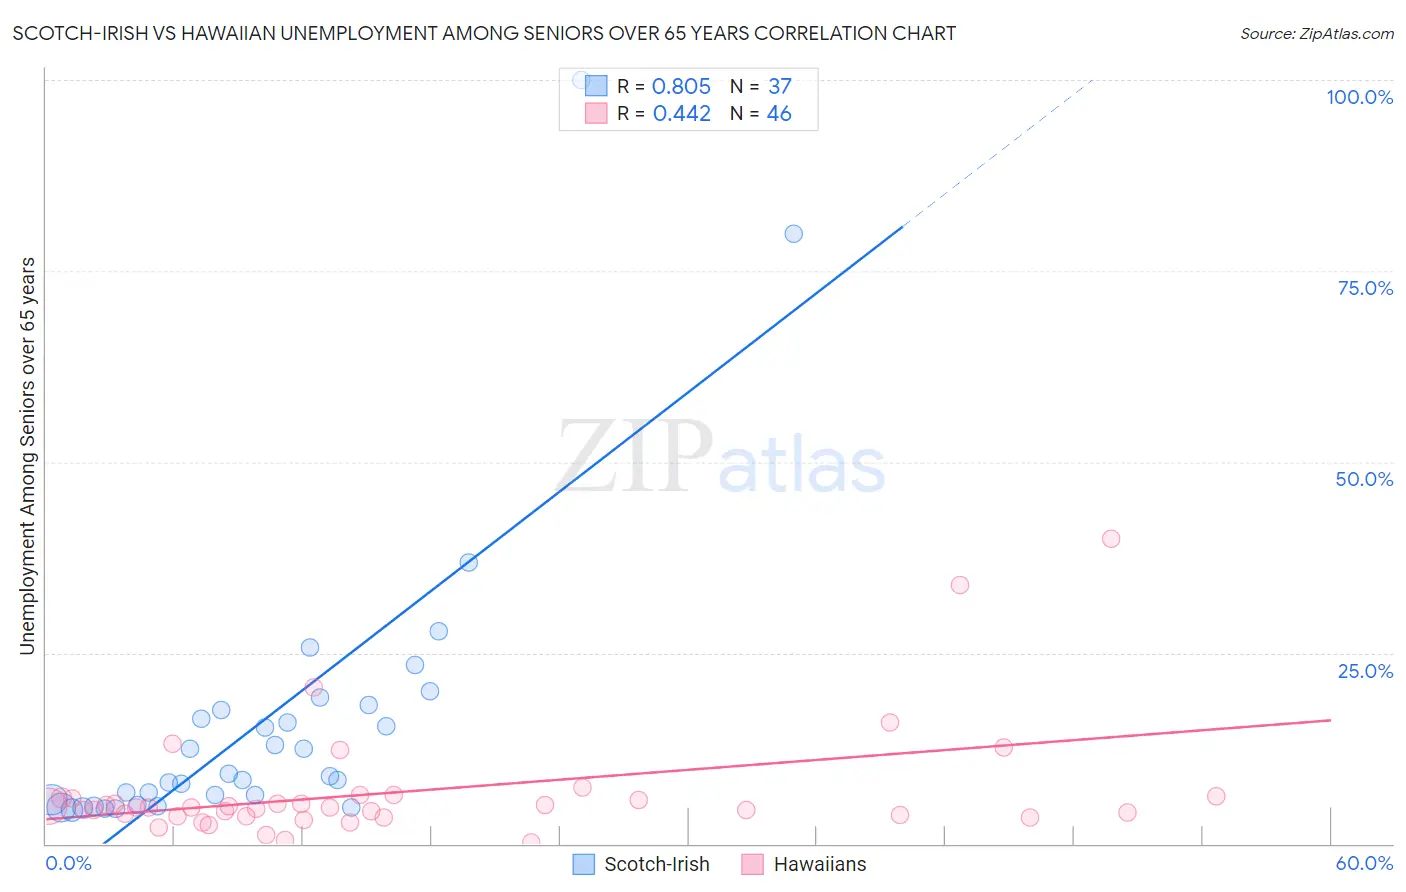
Scotch-Irish vs Hawaiian Unemployment Among Seniors over 65 years Correlation Chart
The statistical analysis conducted on geographies consisting of 447,057,926 people shows a very strong positive correlation between the proportion of Scotch-Irish and unemployment rate amomg seniors over the age of 65 in the United States with a correlation coefficient (R) of 0.805 and weighted average of 4.9%. Similarly, the statistical analysis conducted on geographies consisting of 296,385,493 people shows a moderate positive correlation between the proportion of Hawaiians and unemployment rate amomg seniors over the age of 65 in the United States with a correlation coefficient (R) of 0.442 and weighted average of 5.4%, a difference of 11.0%.
Unemployment Among Seniors over 65 years Correlation Summary
| Measurement | Scotch-Irish | Hawaiian |
| Minimum | 4.4% | 0.20% |
| Maximum | 100.0% | 40.0% |
| Range | 95.6% | 39.8% |
| Mean | 16.1% | 6.8% |
| Median | 8.9% | 4.8% |
| Interquartile 25% (IQ1) | 5.4% | 3.7% |
| Interquartile 75% (IQ3) | 17.8% | 6.0% |
| Interquartile Range (IQR) | 12.3% | 2.3% |
| Standard Deviation (Sample) | 19.6% | 7.5% |
| Standard Deviation (Population) | 19.4% | 7.4% |
Similar Demographics by Unemployment Among Seniors over 65 years
Demographics Similar to Scotch-Irish by Unemployment Among Seniors over 65 years
In terms of unemployment among seniors over 65 years, the demographic groups most similar to Scotch-Irish are Swedish (4.9%, a difference of 0.020%), Immigrants from Sudan (4.9%, a difference of 0.060%), Immigrants from Austria (4.9%, a difference of 0.12%), Immigrants from Iraq (4.9%, a difference of 0.12%), and Immigrants from Kenya (4.9%, a difference of 0.13%).
| Demographics | Rating | Rank | Unemployment Among Seniors over 65 years |
| Jordanians | 99.9 /100 | #44 | Exceptional 4.9% |
| Ethiopians | 99.9 /100 | #45 | Exceptional 4.9% |
| Immigrants | Jordan | 99.9 /100 | #46 | Exceptional 4.9% |
| Germans | 99.9 /100 | #47 | Exceptional 4.9% |
| Choctaw | 99.9 /100 | #48 | Exceptional 4.9% |
| Immigrants | Kenya | 99.9 /100 | #49 | Exceptional 4.9% |
| Immigrants | Austria | 99.9 /100 | #50 | Exceptional 4.9% |
| Scotch-Irish | 99.9 /100 | #51 | Exceptional 4.9% |
| Swedes | 99.9 /100 | #52 | Exceptional 4.9% |
| Immigrants | Sudan | 99.8 /100 | #53 | Exceptional 4.9% |
| Immigrants | Iraq | 99.8 /100 | #54 | Exceptional 4.9% |
| Europeans | 99.8 /100 | #55 | Exceptional 4.9% |
| Carpatho Rusyns | 99.8 /100 | #56 | Exceptional 4.9% |
| Danes | 99.8 /100 | #57 | Exceptional 4.9% |
| Scandinavians | 99.8 /100 | #58 | Exceptional 4.9% |
Demographics Similar to Hawaiians by Unemployment Among Seniors over 65 years
In terms of unemployment among seniors over 65 years, the demographic groups most similar to Hawaiians are Chippewa (5.4%, a difference of 0.10%), Pennsylvania German (5.4%, a difference of 0.11%), Immigrants from Colombia (5.4%, a difference of 0.12%), Central American Indian (5.4%, a difference of 0.13%), and Immigrants from Southern Europe (5.4%, a difference of 0.14%).
| Demographics | Rating | Rank | Unemployment Among Seniors over 65 years |
| Spanish American Indians | 0.2 /100 | #261 | Tragic 5.4% |
| Immigrants | Grenada | 0.2 /100 | #262 | Tragic 5.4% |
| South Americans | 0.2 /100 | #263 | Tragic 5.4% |
| Central American Indians | 0.2 /100 | #264 | Tragic 5.4% |
| Immigrants | Colombia | 0.2 /100 | #265 | Tragic 5.4% |
| Pennsylvania Germans | 0.2 /100 | #266 | Tragic 5.4% |
| Chippewa | 0.2 /100 | #267 | Tragic 5.4% |
| Hawaiians | 0.1 /100 | #268 | Tragic 5.4% |
| Immigrants | Southern Europe | 0.1 /100 | #269 | Tragic 5.4% |
| Immigrants | Morocco | 0.1 /100 | #270 | Tragic 5.4% |
| Cypriots | 0.1 /100 | #271 | Tragic 5.4% |
| Immigrants | Jamaica | 0.1 /100 | #272 | Tragic 5.4% |
| Immigrants | Nigeria | 0.1 /100 | #273 | Tragic 5.4% |
| Immigrants | Brazil | 0.1 /100 | #274 | Tragic 5.4% |
| Mexican American Indians | 0.1 /100 | #275 | Tragic 5.4% |