Scotch-Irish vs Hawaiian Unemployment Among Seniors over 75 years
COMPARE
Scotch-Irish
Hawaiian
Unemployment Among Seniors over 75 years
Unemployment Among Seniors over 75 years Comparison
Scotch-Irish
Hawaiians
10.0%
UNEMPLOYMENT AMONG SENIORS OVER 75 YEARS
0.0/ 100
METRIC RATING
304th/ 347
METRIC RANK
9.3%
UNEMPLOYMENT AMONG SENIORS OVER 75 YEARS
1.2/ 100
METRIC RATING
257th/ 347
METRIC RANK
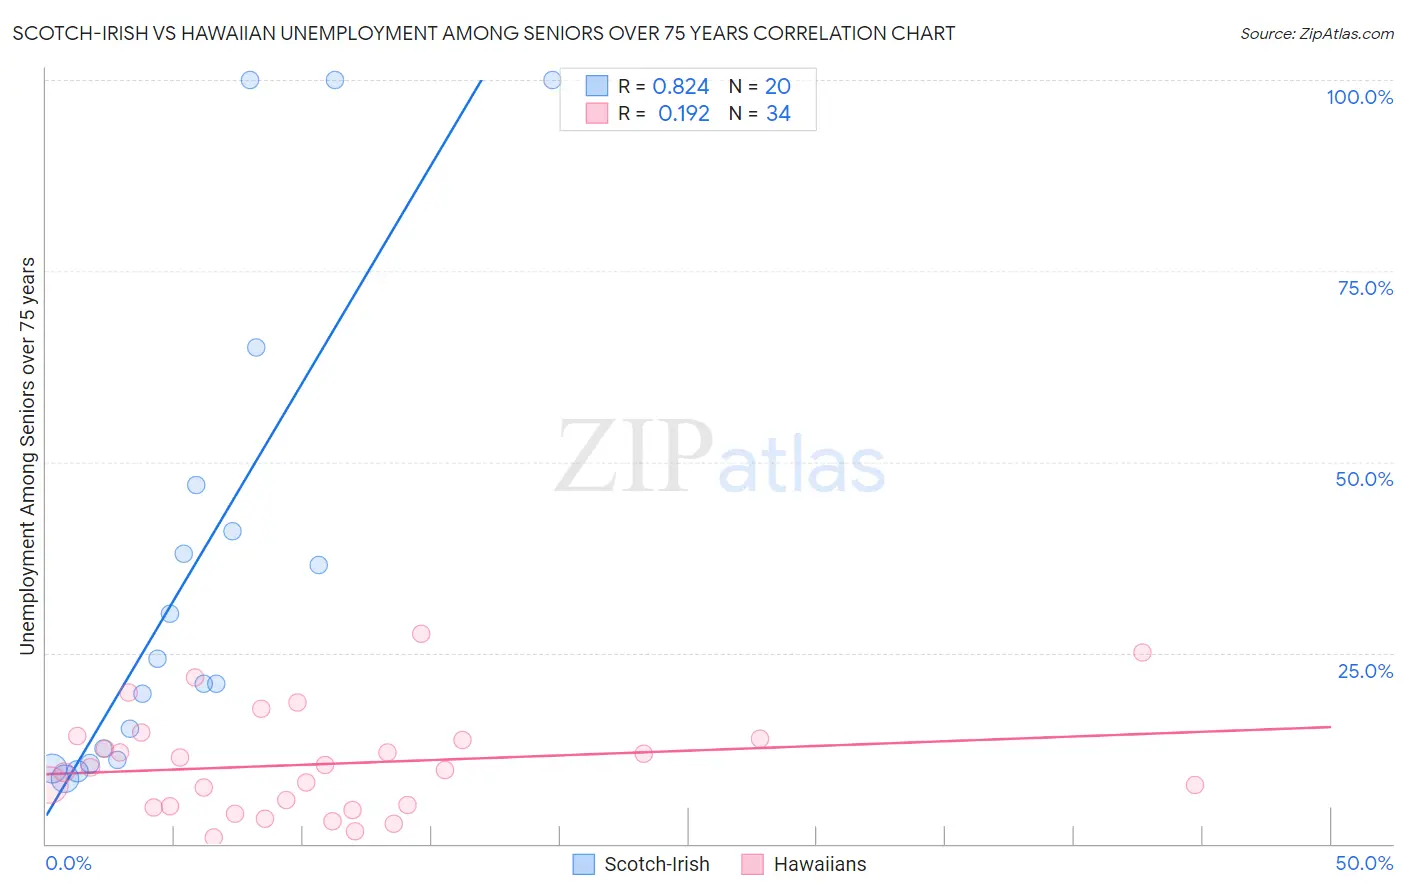
Scotch-Irish vs Hawaiian Unemployment Among Seniors over 75 years Correlation Chart
The statistical analysis conducted on geographies consisting of 229,322,772 people shows a very strong positive correlation between the proportion of Scotch-Irish and unemployment rate among seniors over the age of 75 in the United States with a correlation coefficient (R) of 0.824 and weighted average of 10.0%. Similarly, the statistical analysis conducted on geographies consisting of 176,904,656 people shows a poor positive correlation between the proportion of Hawaiians and unemployment rate among seniors over the age of 75 in the United States with a correlation coefficient (R) of 0.192 and weighted average of 9.3%, a difference of 7.6%.
Unemployment Among Seniors over 75 years Correlation Summary
| Measurement | Scotch-Irish | Hawaiian |
| Minimum | 8.5% | 0.80% |
| Maximum | 100.0% | 27.6% |
| Range | 91.5% | 26.8% |
| Mean | 36.0% | 10.5% |
| Median | 22.6% | 9.9% |
| Interquartile 25% (IQ1) | 11.7% | 4.9% |
| Interquartile 75% (IQ3) | 44.0% | 13.8% |
| Interquartile Range (IQR) | 32.3% | 8.9% |
| Standard Deviation (Sample) | 31.3% | 6.7% |
| Standard Deviation (Population) | 30.5% | 6.6% |
Similar Demographics by Unemployment Among Seniors over 75 years
Demographics Similar to Scotch-Irish by Unemployment Among Seniors over 75 years
In terms of unemployment among seniors over 75 years, the demographic groups most similar to Scotch-Irish are Puget Sound Salish (10.0%, a difference of 0.010%), Finnish (10.0%, a difference of 0.080%), Welsh (10.0%, a difference of 0.19%), Swedish (10.0%, a difference of 0.19%), and Italian (10.0%, a difference of 0.34%).
| Demographics | Rating | Rank | Unemployment Among Seniors over 75 years |
| Cherokee | 0.0 /100 | #297 | Tragic 9.8% |
| Lithuanians | 0.0 /100 | #298 | Tragic 9.9% |
| Belgians | 0.0 /100 | #299 | Tragic 9.9% |
| Iraqis | 0.0 /100 | #300 | Tragic 9.9% |
| Welsh | 0.0 /100 | #301 | Tragic 10.0% |
| Finns | 0.0 /100 | #302 | Tragic 10.0% |
| Puget Sound Salish | 0.0 /100 | #303 | Tragic 10.0% |
| Scotch-Irish | 0.0 /100 | #304 | Tragic 10.0% |
| Swedes | 0.0 /100 | #305 | Tragic 10.0% |
| Italians | 0.0 /100 | #306 | Tragic 10.0% |
| Immigrants | Fiji | 0.0 /100 | #307 | Tragic 10.0% |
| Whites/Caucasians | 0.0 /100 | #308 | Tragic 10.1% |
| English | 0.0 /100 | #309 | Tragic 10.1% |
| Hungarians | 0.0 /100 | #310 | Tragic 10.1% |
| Scottish | 0.0 /100 | #311 | Tragic 10.1% |
Demographics Similar to Hawaiians by Unemployment Among Seniors over 75 years
In terms of unemployment among seniors over 75 years, the demographic groups most similar to Hawaiians are Brazilian (9.3%, a difference of 0.12%), Immigrants from England (9.3%, a difference of 0.14%), Slovene (9.3%, a difference of 0.16%), Immigrants from Cameroon (9.3%, a difference of 0.21%), and Immigrants from Scotland (9.2%, a difference of 0.27%).
| Demographics | Rating | Rank | Unemployment Among Seniors over 75 years |
| Central American Indians | 2.2 /100 | #250 | Tragic 9.2% |
| Immigrants | Poland | 2.0 /100 | #251 | Tragic 9.2% |
| Immigrants | Sudan | 2.0 /100 | #252 | Tragic 9.2% |
| Pima | 1.8 /100 | #253 | Tragic 9.2% |
| Immigrants | Ghana | 1.7 /100 | #254 | Tragic 9.2% |
| Immigrants | Scotland | 1.4 /100 | #255 | Tragic 9.2% |
| Brazilians | 1.3 /100 | #256 | Tragic 9.3% |
| Hawaiians | 1.2 /100 | #257 | Tragic 9.3% |
| Immigrants | England | 1.0 /100 | #258 | Tragic 9.3% |
| Slovenes | 1.0 /100 | #259 | Tragic 9.3% |
| Immigrants | Cameroon | 1.0 /100 | #260 | Tragic 9.3% |
| Celtics | 0.8 /100 | #261 | Tragic 9.3% |
| Austrians | 0.7 /100 | #262 | Tragic 9.3% |
| Ukrainians | 0.7 /100 | #263 | Tragic 9.3% |
| Iroquois | 0.7 /100 | #264 | Tragic 9.3% |