Scotch-Irish vs Immigrants from Switzerland Female Disability
COMPARE
Scotch-Irish
Immigrants from Switzerland
Female Disability
Female Disability Comparison
Scotch-Irish
Immigrants from Switzerland
13.4%
FEMALE DISABILITY
0.0/ 100
METRIC RATING
302nd/ 347
METRIC RANK
11.5%
FEMALE DISABILITY
99.8/ 100
METRIC RATING
73rd/ 347
METRIC RANK
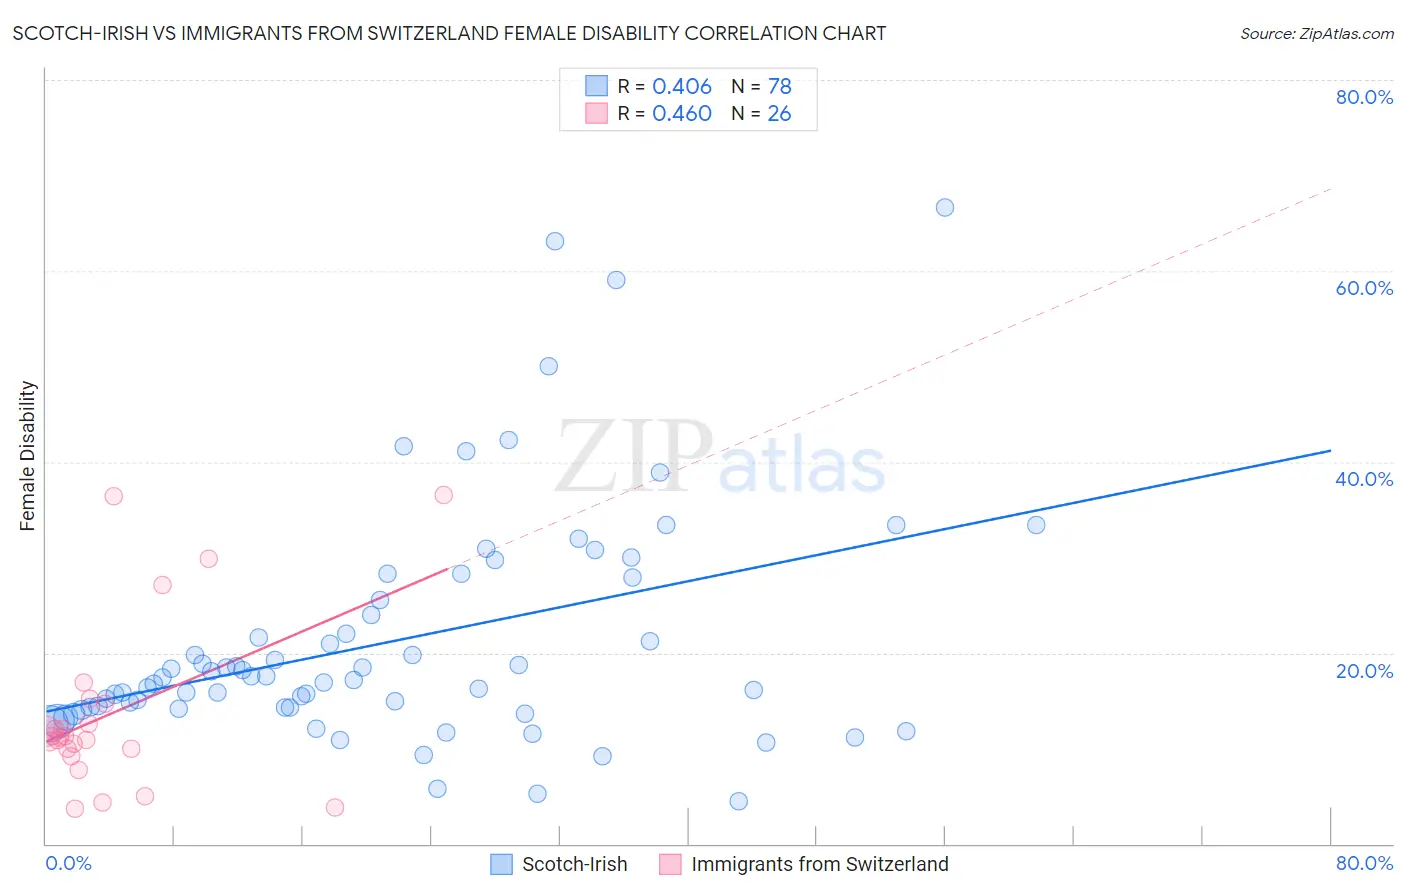
Scotch-Irish vs Immigrants from Switzerland Female Disability Correlation Chart
The statistical analysis conducted on geographies consisting of 548,573,243 people shows a moderate positive correlation between the proportion of Scotch-Irish and percentage of females with a disability in the United States with a correlation coefficient (R) of 0.406 and weighted average of 13.4%. Similarly, the statistical analysis conducted on geographies consisting of 148,080,197 people shows a moderate positive correlation between the proportion of Immigrants from Switzerland and percentage of females with a disability in the United States with a correlation coefficient (R) of 0.460 and weighted average of 11.5%, a difference of 17.0%.
Female Disability Correlation Summary
| Measurement | Scotch-Irish | Immigrants from Switzerland |
| Minimum | 4.4% | 3.7% |
| Maximum | 66.7% | 36.5% |
| Range | 62.3% | 32.8% |
| Mean | 21.2% | 13.7% |
| Median | 17.3% | 11.2% |
| Interquartile 25% (IQ1) | 14.2% | 10.0% |
| Interquartile 75% (IQ3) | 25.5% | 14.6% |
| Interquartile Range (IQR) | 11.2% | 4.6% |
| Standard Deviation (Sample) | 12.3% | 8.9% |
| Standard Deviation (Population) | 12.2% | 8.8% |
Similar Demographics by Female Disability
Demographics Similar to Scotch-Irish by Female Disability
In terms of female disability, the demographic groups most similar to Scotch-Irish are Immigrants from Portugal (13.5%, a difference of 0.0%), Immigrants from Micronesia (13.5%, a difference of 0.030%), African (13.4%, a difference of 0.14%), Pennsylvania German (13.4%, a difference of 0.34%), and Immigrants from Dominican Republic (13.4%, a difference of 0.35%).
| Demographics | Rating | Rank | Female Disability |
| French | 0.0 /100 | #295 | Tragic 13.3% |
| Nepalese | 0.0 /100 | #296 | Tragic 13.3% |
| Slovaks | 0.0 /100 | #297 | Tragic 13.3% |
| Immigrants | Nonimmigrants | 0.0 /100 | #298 | Tragic 13.4% |
| Immigrants | Dominican Republic | 0.0 /100 | #299 | Tragic 13.4% |
| Pennsylvania Germans | 0.0 /100 | #300 | Tragic 13.4% |
| Africans | 0.0 /100 | #301 | Tragic 13.4% |
| Scotch-Irish | 0.0 /100 | #302 | Tragic 13.4% |
| Immigrants | Portugal | 0.0 /100 | #303 | Tragic 13.5% |
| Immigrants | Micronesia | 0.0 /100 | #304 | Tragic 13.5% |
| Dominicans | 0.0 /100 | #305 | Tragic 13.5% |
| French Canadians | 0.0 /100 | #306 | Tragic 13.6% |
| Central American Indians | 0.0 /100 | #307 | Tragic 13.6% |
| Cree | 0.0 /100 | #308 | Tragic 13.7% |
| French American Indians | 0.0 /100 | #309 | Tragic 13.7% |
Demographics Similar to Immigrants from Switzerland by Female Disability
In terms of female disability, the demographic groups most similar to Immigrants from Switzerland are Chilean (11.5%, a difference of 0.020%), Immigrants from Ireland (11.5%, a difference of 0.080%), Bhutanese (11.5%, a difference of 0.080%), Immigrants from Chile (11.5%, a difference of 0.13%), and Colombian (11.5%, a difference of 0.14%).
| Demographics | Rating | Rank | Female Disability |
| Salvadorans | 99.8 /100 | #66 | Exceptional 11.5% |
| Immigrants | Vietnam | 99.8 /100 | #67 | Exceptional 11.5% |
| Immigrants | Northern Africa | 99.8 /100 | #68 | Exceptional 11.5% |
| Colombians | 99.8 /100 | #69 | Exceptional 11.5% |
| Immigrants | Chile | 99.8 /100 | #70 | Exceptional 11.5% |
| Immigrants | Ireland | 99.8 /100 | #71 | Exceptional 11.5% |
| Chileans | 99.8 /100 | #72 | Exceptional 11.5% |
| Immigrants | Switzerland | 99.8 /100 | #73 | Exceptional 11.5% |
| Bhutanese | 99.8 /100 | #74 | Exceptional 11.5% |
| Immigrants | Lebanon | 99.7 /100 | #75 | Exceptional 11.5% |
| Immigrants | Eritrea | 99.7 /100 | #76 | Exceptional 11.5% |
| Immigrants | Afghanistan | 99.7 /100 | #77 | Exceptional 11.5% |
| Immigrants | South Africa | 99.7 /100 | #78 | Exceptional 11.5% |
| Sierra Leoneans | 99.7 /100 | #79 | Exceptional 11.5% |
| Immigrants | Jordan | 99.7 /100 | #80 | Exceptional 11.5% |