Scotch-Irish vs Dutch Female Disability
COMPARE
Scotch-Irish
Dutch
Female Disability
Female Disability Comparison
Scotch-Irish
Dutch
13.4%
FEMALE DISABILITY
0.0/ 100
METRIC RATING
302nd/ 347
METRIC RANK
12.9%
FEMALE DISABILITY
0.2/ 100
METRIC RATING
271st/ 347
METRIC RANK
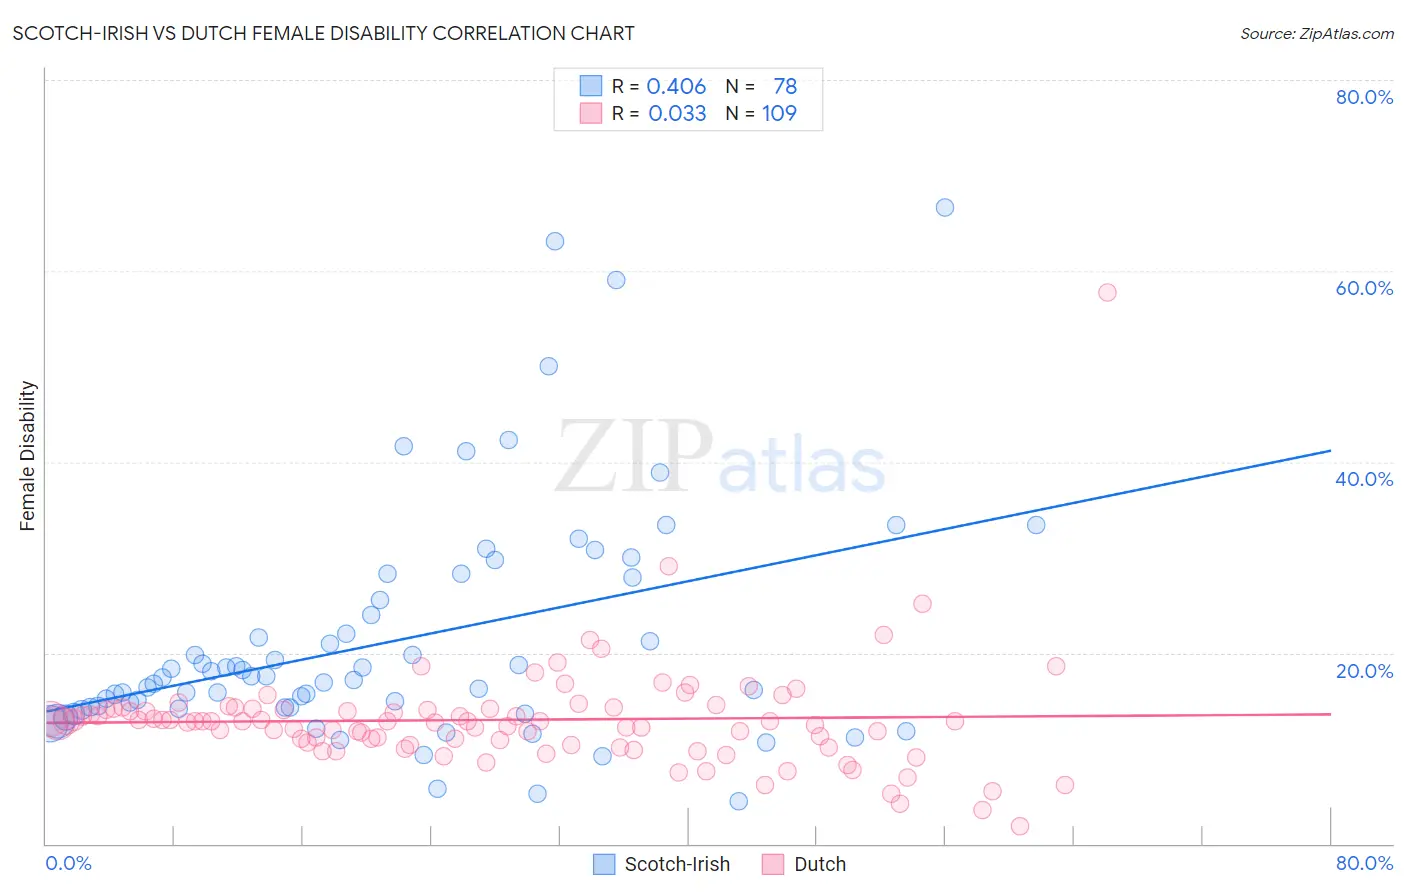
Scotch-Irish vs Dutch Female Disability Correlation Chart
The statistical analysis conducted on geographies consisting of 548,573,243 people shows a moderate positive correlation between the proportion of Scotch-Irish and percentage of females with a disability in the United States with a correlation coefficient (R) of 0.406 and weighted average of 13.4%. Similarly, the statistical analysis conducted on geographies consisting of 554,147,365 people shows no correlation between the proportion of Dutch and percentage of females with a disability in the United States with a correlation coefficient (R) of 0.033 and weighted average of 12.9%, a difference of 4.1%.
Female Disability Correlation Summary
| Measurement | Scotch-Irish | Dutch |
| Minimum | 4.4% | 1.9% |
| Maximum | 66.7% | 57.7% |
| Range | 62.3% | 55.9% |
| Mean | 21.2% | 13.0% |
| Median | 17.3% | 12.8% |
| Interquartile 25% (IQ1) | 14.2% | 10.5% |
| Interquartile 75% (IQ3) | 25.5% | 14.1% |
| Interquartile Range (IQR) | 11.2% | 3.7% |
| Standard Deviation (Sample) | 12.3% | 5.9% |
| Standard Deviation (Population) | 12.2% | 5.9% |
Similar Demographics by Female Disability
Demographics Similar to Scotch-Irish by Female Disability
In terms of female disability, the demographic groups most similar to Scotch-Irish are Immigrants from Portugal (13.5%, a difference of 0.0%), Immigrants from Micronesia (13.5%, a difference of 0.030%), African (13.4%, a difference of 0.14%), Pennsylvania German (13.4%, a difference of 0.34%), and Immigrants from Dominican Republic (13.4%, a difference of 0.35%).
| Demographics | Rating | Rank | Female Disability |
| French | 0.0 /100 | #295 | Tragic 13.3% |
| Nepalese | 0.0 /100 | #296 | Tragic 13.3% |
| Slovaks | 0.0 /100 | #297 | Tragic 13.3% |
| Immigrants | Nonimmigrants | 0.0 /100 | #298 | Tragic 13.4% |
| Immigrants | Dominican Republic | 0.0 /100 | #299 | Tragic 13.4% |
| Pennsylvania Germans | 0.0 /100 | #300 | Tragic 13.4% |
| Africans | 0.0 /100 | #301 | Tragic 13.4% |
| Scotch-Irish | 0.0 /100 | #302 | Tragic 13.4% |
| Immigrants | Portugal | 0.0 /100 | #303 | Tragic 13.5% |
| Immigrants | Micronesia | 0.0 /100 | #304 | Tragic 13.5% |
| Dominicans | 0.0 /100 | #305 | Tragic 13.5% |
| French Canadians | 0.0 /100 | #306 | Tragic 13.6% |
| Central American Indians | 0.0 /100 | #307 | Tragic 13.6% |
| Cree | 0.0 /100 | #308 | Tragic 13.7% |
| French American Indians | 0.0 /100 | #309 | Tragic 13.7% |
Demographics Similar to Dutch by Female Disability
In terms of female disability, the demographic groups most similar to Dutch are German (12.9%, a difference of 0.21%), Sioux (12.9%, a difference of 0.23%), Portuguese (13.0%, a difference of 0.35%), Cheyenne (13.0%, a difference of 0.40%), and Immigrants from Dominica (13.0%, a difference of 0.45%).
| Demographics | Rating | Rank | Female Disability |
| Alaska Natives | 0.6 /100 | #264 | Tragic 12.8% |
| West Indians | 0.5 /100 | #265 | Tragic 12.8% |
| Finns | 0.4 /100 | #266 | Tragic 12.8% |
| Senegalese | 0.4 /100 | #267 | Tragic 12.8% |
| Immigrants | Laos | 0.4 /100 | #268 | Tragic 12.8% |
| Indonesians | 0.4 /100 | #269 | Tragic 12.8% |
| Immigrants | Liberia | 0.3 /100 | #270 | Tragic 12.9% |
| Dutch | 0.2 /100 | #271 | Tragic 12.9% |
| Germans | 0.1 /100 | #272 | Tragic 12.9% |
| Sioux | 0.1 /100 | #273 | Tragic 12.9% |
| Portuguese | 0.1 /100 | #274 | Tragic 13.0% |
| Cheyenne | 0.1 /100 | #275 | Tragic 13.0% |
| Immigrants | Dominica | 0.1 /100 | #276 | Tragic 13.0% |
| Spanish | 0.1 /100 | #277 | Tragic 13.0% |
| Scottish | 0.1 /100 | #278 | Tragic 13.0% |