Scotch-Irish vs Hawaiian Unemployment Among Ages 30 to 34 years
COMPARE
Scotch-Irish
Hawaiian
Unemployment Among Ages 30 to 34 years
Unemployment Among Ages 30 to 34 years Comparison
Scotch-Irish
Hawaiians
5.7%
UNEMPLOYMENT AMONG AGES 30 TO 34 YEARS
8.6/ 100
METRIC RATING
212th/ 347
METRIC RANK
5.9%
UNEMPLOYMENT AMONG AGES 30 TO 34 YEARS
1.2/ 100
METRIC RATING
230th/ 347
METRIC RANK
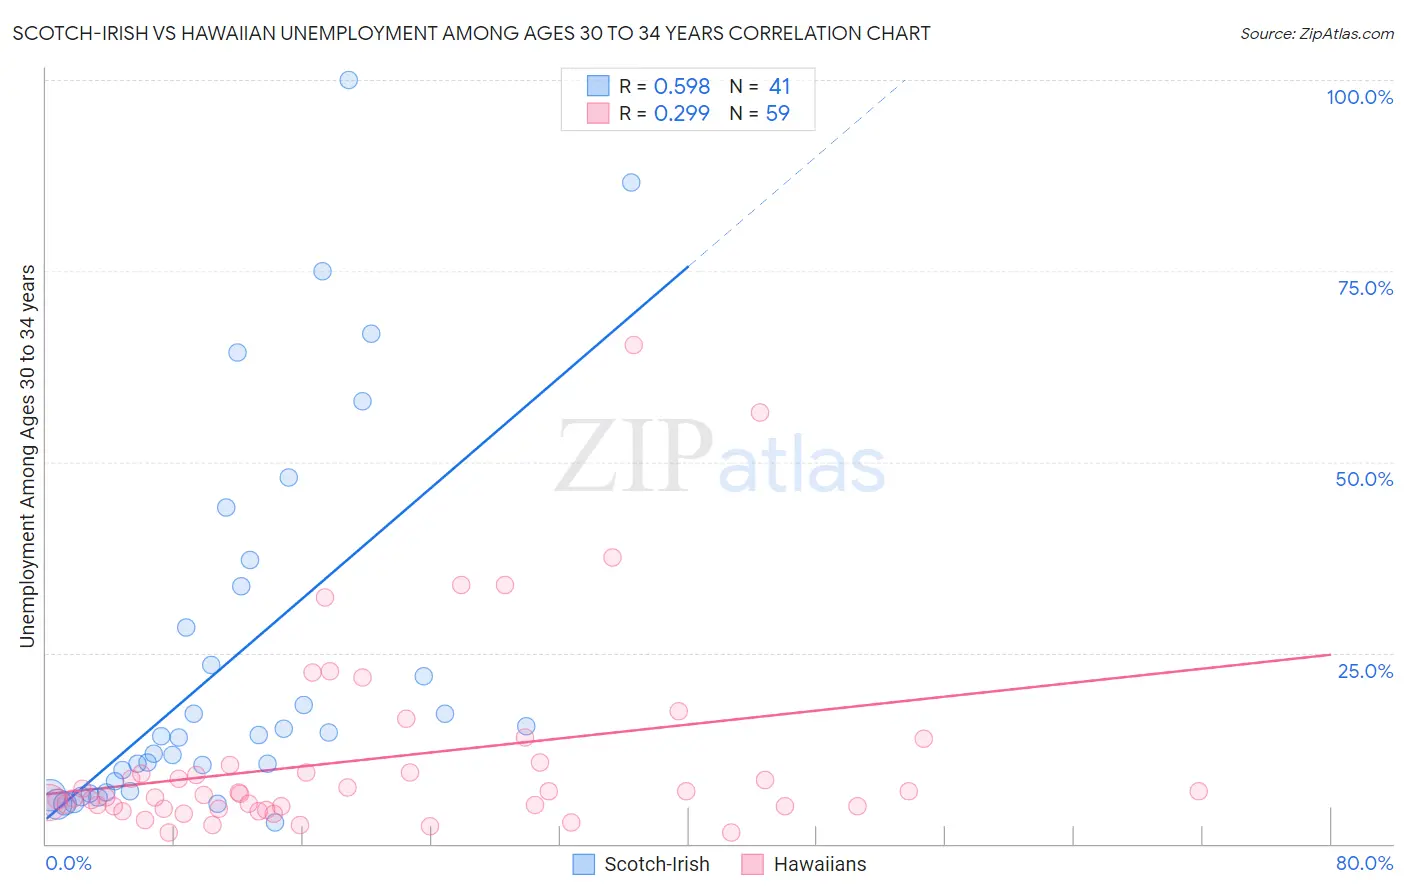
Scotch-Irish vs Hawaiian Unemployment Among Ages 30 to 34 years Correlation Chart
The statistical analysis conducted on geographies consisting of 482,054,046 people shows a substantial positive correlation between the proportion of Scotch-Irish and unemployment rate among population between the ages 30 and 34 in the United States with a correlation coefficient (R) of 0.598 and weighted average of 5.7%. Similarly, the statistical analysis conducted on geographies consisting of 312,816,789 people shows a weak positive correlation between the proportion of Hawaiians and unemployment rate among population between the ages 30 and 34 in the United States with a correlation coefficient (R) of 0.299 and weighted average of 5.9%, a difference of 3.4%.
Unemployment Among Ages 30 to 34 years Correlation Summary
| Measurement | Scotch-Irish | Hawaiian |
| Minimum | 2.8% | 1.4% |
| Maximum | 100.0% | 65.4% |
| Range | 97.2% | 64.0% |
| Mean | 23.7% | 11.1% |
| Median | 14.0% | 6.6% |
| Interquartile 25% (IQ1) | 6.8% | 4.9% |
| Interquartile 75% (IQ3) | 31.1% | 10.2% |
| Interquartile Range (IQR) | 24.3% | 5.4% |
| Standard Deviation (Sample) | 24.5% | 12.6% |
| Standard Deviation (Population) | 24.2% | 12.5% |
Demographics Similar to Scotch-Irish and Hawaiians by Unemployment Among Ages 30 to 34 years
In terms of unemployment among ages 30 to 34 years, the demographic groups most similar to Scotch-Irish are Spanish American Indian (5.7%, a difference of 0.010%), Immigrants (5.7%, a difference of 0.35%), Immigrants from Panama (5.7%, a difference of 0.69%), Immigrants from Cambodia (5.7%, a difference of 0.70%), and Immigrants from Syria (5.7%, a difference of 0.81%). Similarly, the demographic groups most similar to Hawaiians are Japanese (5.9%, a difference of 0.13%), Immigrants from Uzbekistan (5.9%, a difference of 0.32%), Immigrants from Bahamas (5.8%, a difference of 0.64%), Spanish (5.8%, a difference of 0.71%), and Liberian (5.8%, a difference of 1.1%).
| Demographics | Rating | Rank | Unemployment Among Ages 30 to 34 years |
| Spanish American Indians | 8.7 /100 | #211 | Tragic 5.7% |
| Scotch-Irish | 8.6 /100 | #212 | Tragic 5.7% |
| Immigrants | Immigrants | 7.1 /100 | #213 | Tragic 5.7% |
| Immigrants | Panama | 5.9 /100 | #214 | Tragic 5.7% |
| Immigrants | Cambodia | 5.8 /100 | #215 | Tragic 5.7% |
| Immigrants | Syria | 5.5 /100 | #216 | Tragic 5.7% |
| Immigrants | Fiji | 5.1 /100 | #217 | Tragic 5.7% |
| Panamanians | 4.5 /100 | #218 | Tragic 5.8% |
| French Canadians | 4.4 /100 | #219 | Tragic 5.8% |
| Sierra Leoneans | 3.9 /100 | #220 | Tragic 5.8% |
| Guamanians/Chamorros | 3.9 /100 | #221 | Tragic 5.8% |
| Spaniards | 3.2 /100 | #222 | Tragic 5.8% |
| Bermudans | 2.7 /100 | #223 | Tragic 5.8% |
| Slovaks | 2.5 /100 | #224 | Tragic 5.8% |
| Samoans | 2.5 /100 | #225 | Tragic 5.8% |
| Liberians | 2.3 /100 | #226 | Tragic 5.8% |
| Spanish | 1.8 /100 | #227 | Tragic 5.8% |
| Immigrants | Bahamas | 1.8 /100 | #228 | Tragic 5.8% |
| Immigrants | Uzbekistan | 1.5 /100 | #229 | Tragic 5.9% |
| Hawaiians | 1.2 /100 | #230 | Tragic 5.9% |
| Japanese | 1.1 /100 | #231 | Tragic 5.9% |