Scotch-Irish vs Immigrants from Philippines Female Disability
COMPARE
Scotch-Irish
Immigrants from Philippines
Female Disability
Female Disability Comparison
Scotch-Irish
Immigrants from Philippines
13.4%
FEMALE DISABILITY
0.0/ 100
METRIC RATING
302nd/ 347
METRIC RANK
11.7%
FEMALE DISABILITY
98.6/ 100
METRIC RATING
99th/ 347
METRIC RANK
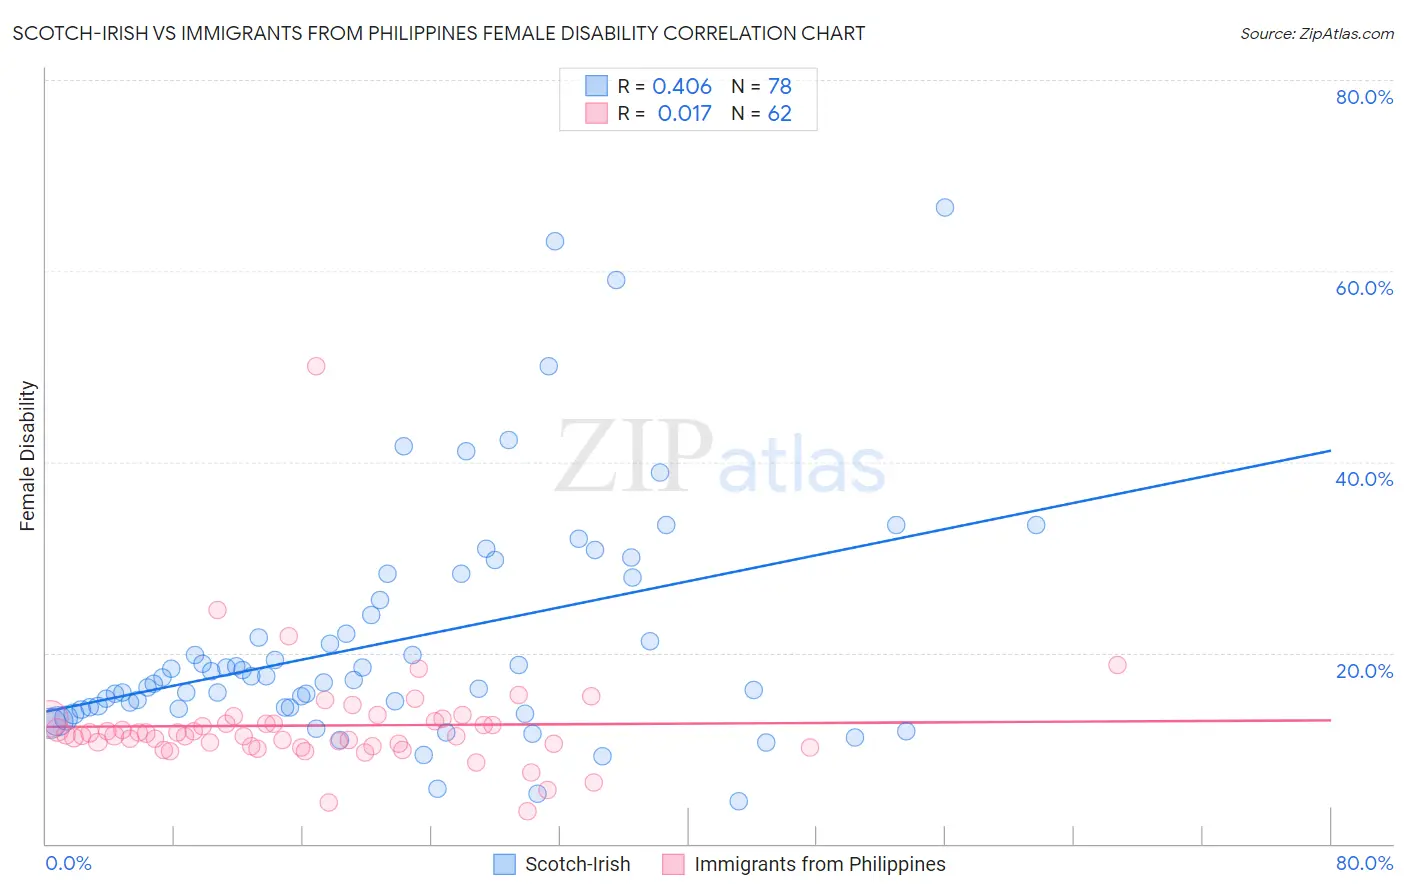
Scotch-Irish vs Immigrants from Philippines Female Disability Correlation Chart
The statistical analysis conducted on geographies consisting of 548,573,243 people shows a moderate positive correlation between the proportion of Scotch-Irish and percentage of females with a disability in the United States with a correlation coefficient (R) of 0.406 and weighted average of 13.4%. Similarly, the statistical analysis conducted on geographies consisting of 471,161,268 people shows no correlation between the proportion of Immigrants from Philippines and percentage of females with a disability in the United States with a correlation coefficient (R) of 0.017 and weighted average of 11.7%, a difference of 14.8%.
Female Disability Correlation Summary
| Measurement | Scotch-Irish | Immigrants from Philippines |
| Minimum | 4.4% | 3.4% |
| Maximum | 66.7% | 50.0% |
| Range | 62.3% | 46.6% |
| Mean | 21.2% | 12.4% |
| Median | 17.3% | 11.4% |
| Interquartile 25% (IQ1) | 14.2% | 10.3% |
| Interquartile 75% (IQ3) | 25.5% | 12.8% |
| Interquartile Range (IQR) | 11.2% | 2.6% |
| Standard Deviation (Sample) | 12.3% | 5.9% |
| Standard Deviation (Population) | 12.2% | 5.9% |
Similar Demographics by Female Disability
Demographics Similar to Scotch-Irish by Female Disability
In terms of female disability, the demographic groups most similar to Scotch-Irish are Immigrants from Portugal (13.5%, a difference of 0.0%), Immigrants from Micronesia (13.5%, a difference of 0.030%), African (13.4%, a difference of 0.14%), Pennsylvania German (13.4%, a difference of 0.34%), and Immigrants from Dominican Republic (13.4%, a difference of 0.35%).
| Demographics | Rating | Rank | Female Disability |
| French | 0.0 /100 | #295 | Tragic 13.3% |
| Nepalese | 0.0 /100 | #296 | Tragic 13.3% |
| Slovaks | 0.0 /100 | #297 | Tragic 13.3% |
| Immigrants | Nonimmigrants | 0.0 /100 | #298 | Tragic 13.4% |
| Immigrants | Dominican Republic | 0.0 /100 | #299 | Tragic 13.4% |
| Pennsylvania Germans | 0.0 /100 | #300 | Tragic 13.4% |
| Africans | 0.0 /100 | #301 | Tragic 13.4% |
| Scotch-Irish | 0.0 /100 | #302 | Tragic 13.4% |
| Immigrants | Portugal | 0.0 /100 | #303 | Tragic 13.5% |
| Immigrants | Micronesia | 0.0 /100 | #304 | Tragic 13.5% |
| Dominicans | 0.0 /100 | #305 | Tragic 13.5% |
| French Canadians | 0.0 /100 | #306 | Tragic 13.6% |
| Central American Indians | 0.0 /100 | #307 | Tragic 13.6% |
| Cree | 0.0 /100 | #308 | Tragic 13.7% |
| French American Indians | 0.0 /100 | #309 | Tragic 13.7% |
Demographics Similar to Immigrants from Philippines by Female Disability
In terms of female disability, the demographic groups most similar to Immigrants from Philippines are Immigrants from Uruguay (11.7%, a difference of 0.050%), Immigrants from Costa Rica (11.7%, a difference of 0.070%), Immigrants from South Eastern Asia (11.7%, a difference of 0.080%), Immigrants from Eastern Africa (11.7%, a difference of 0.15%), and Immigrants from Western Asia (11.7%, a difference of 0.16%).
| Demographics | Rating | Rank | Female Disability |
| Immigrants | Czechoslovakia | 99.5 /100 | #92 | Exceptional 11.6% |
| Immigrants | Sierra Leone | 99.4 /100 | #93 | Exceptional 11.6% |
| Immigrants | Brazil | 99.4 /100 | #94 | Exceptional 11.6% |
| Immigrants | Northern Europe | 99.4 /100 | #95 | Exceptional 11.6% |
| Immigrants | Russia | 99.0 /100 | #96 | Exceptional 11.7% |
| Koreans | 99.0 /100 | #97 | Exceptional 11.7% |
| Uruguayans | 98.8 /100 | #98 | Exceptional 11.7% |
| Immigrants | Philippines | 98.6 /100 | #99 | Exceptional 11.7% |
| Immigrants | Uruguay | 98.5 /100 | #100 | Exceptional 11.7% |
| Immigrants | Costa Rica | 98.4 /100 | #101 | Exceptional 11.7% |
| Immigrants | South Eastern Asia | 98.4 /100 | #102 | Exceptional 11.7% |
| Immigrants | Eastern Africa | 98.3 /100 | #103 | Exceptional 11.7% |
| Immigrants | Western Asia | 98.3 /100 | #104 | Exceptional 11.7% |
| Australians | 98.3 /100 | #105 | Exceptional 11.7% |
| Immigrants | Greece | 98.2 /100 | #106 | Exceptional 11.7% |