Scotch-Irish vs Dutch Divorced or Separated
COMPARE
Scotch-Irish
Dutch
Divorced or Separated
Divorced or Separated Comparison
Scotch-Irish
Dutch
12.9%
DIVORCED OR SEPARATED
0.0/ 100
METRIC RATING
292nd/ 347
METRIC RANK
12.4%
DIVORCED OR SEPARATED
3.1/ 100
METRIC RATING
242nd/ 347
METRIC RANK
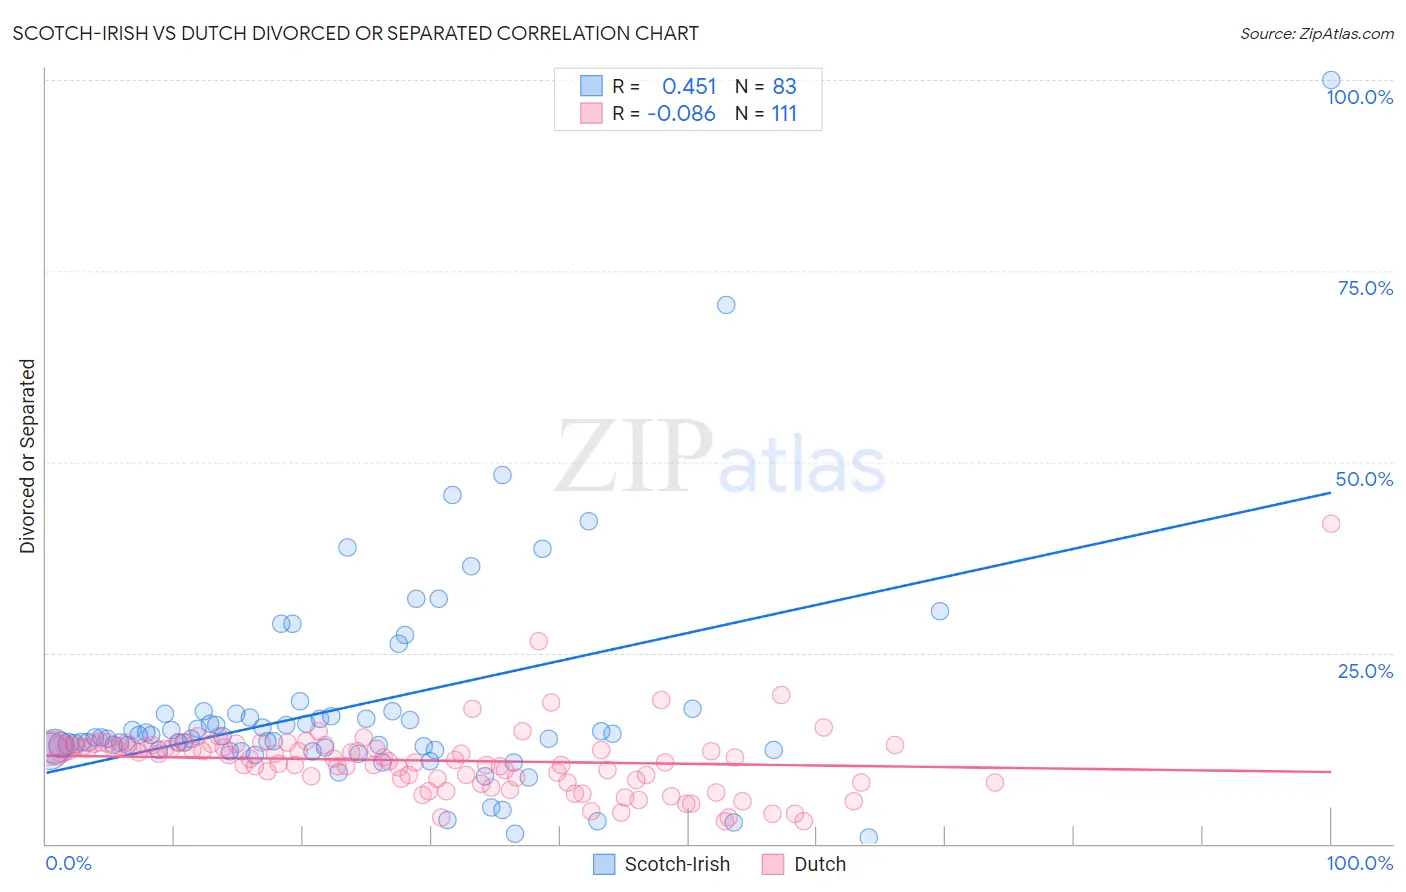
Scotch-Irish vs Dutch Divorced or Separated Correlation Chart
The statistical analysis conducted on geographies consisting of 548,485,641 people shows a moderate positive correlation between the proportion of Scotch-Irish and percentage of population currently divorced or separated in the United States with a correlation coefficient (R) of 0.451 and weighted average of 12.9%. Similarly, the statistical analysis conducted on geographies consisting of 553,980,787 people shows a slight negative correlation between the proportion of Dutch and percentage of population currently divorced or separated in the United States with a correlation coefficient (R) of -0.086 and weighted average of 12.4%, a difference of 3.9%.
Divorced or Separated Correlation Summary
| Measurement | Scotch-Irish | Dutch |
| Minimum | 0.80% | 3.0% |
| Maximum | 100.0% | 41.8% |
| Range | 99.2% | 38.9% |
| Mean | 17.9% | 10.9% |
| Median | 13.9% | 11.1% |
| Interquartile 25% (IQ1) | 12.3% | 8.3% |
| Interquartile 75% (IQ3) | 17.0% | 12.8% |
| Interquartile Range (IQR) | 4.7% | 4.5% |
| Standard Deviation (Sample) | 14.3% | 4.7% |
| Standard Deviation (Population) | 14.2% | 4.7% |
Similar Demographics by Divorced or Separated
Demographics Similar to Scotch-Irish by Divorced or Separated
In terms of divorced or separated, the demographic groups most similar to Scotch-Irish are Immigrants from Honduras (12.9%, a difference of 0.060%), Pima (12.9%, a difference of 0.17%), Jamaican (12.9%, a difference of 0.21%), Apache (12.9%, a difference of 0.24%), and Iroquois (12.9%, a difference of 0.32%).
| Demographics | Rating | Rank | Divorced or Separated |
| French | 0.1 /100 | #285 | Tragic 12.8% |
| Spanish | 0.1 /100 | #286 | Tragic 12.8% |
| Hondurans | 0.1 /100 | #287 | Tragic 12.8% |
| French Canadians | 0.1 /100 | #288 | Tragic 12.8% |
| Iroquois | 0.0 /100 | #289 | Tragic 12.9% |
| Pima | 0.0 /100 | #290 | Tragic 12.9% |
| Immigrants | Honduras | 0.0 /100 | #291 | Tragic 12.9% |
| Scotch-Irish | 0.0 /100 | #292 | Tragic 12.9% |
| Jamaicans | 0.0 /100 | #293 | Tragic 12.9% |
| Apache | 0.0 /100 | #294 | Tragic 12.9% |
| Celtics | 0.0 /100 | #295 | Tragic 13.0% |
| Nicaraguans | 0.0 /100 | #296 | Tragic 13.0% |
| Natives/Alaskans | 0.0 /100 | #297 | Tragic 13.0% |
| Venezuelans | 0.0 /100 | #298 | Tragic 13.0% |
| Immigrants | Jamaica | 0.0 /100 | #299 | Tragic 13.0% |
Demographics Similar to Dutch by Divorced or Separated
In terms of divorced or separated, the demographic groups most similar to Dutch are Immigrants from Latin America (12.4%, a difference of 0.070%), Uruguayan (12.4%, a difference of 0.090%), British West Indian (12.4%, a difference of 0.17%), Alaska Native (12.4%, a difference of 0.17%), and Immigrants from Germany (12.4%, a difference of 0.23%).
| Demographics | Rating | Rank | Divorced or Separated |
| Immigrants | Bosnia and Herzegovina | 4.3 /100 | #235 | Tragic 12.4% |
| Colombians | 4.2 /100 | #236 | Tragic 12.4% |
| Immigrants | Laos | 4.2 /100 | #237 | Tragic 12.4% |
| Sudanese | 4.0 /100 | #238 | Tragic 12.4% |
| Immigrants | Germany | 4.0 /100 | #239 | Tragic 12.4% |
| British West Indians | 3.7 /100 | #240 | Tragic 12.4% |
| Uruguayans | 3.4 /100 | #241 | Tragic 12.4% |
| Dutch | 3.1 /100 | #242 | Tragic 12.4% |
| Immigrants | Latin America | 2.8 /100 | #243 | Tragic 12.4% |
| Alaska Natives | 2.5 /100 | #244 | Tragic 12.4% |
| Hispanics or Latinos | 2.0 /100 | #245 | Tragic 12.5% |
| Immigrants | West Indies | 1.9 /100 | #246 | Tragic 12.5% |
| Germans | 1.8 /100 | #247 | Tragic 12.5% |
| Nepalese | 1.8 /100 | #248 | Tragic 12.5% |
| Finns | 1.8 /100 | #249 | Tragic 12.5% |