Venezuelan vs Dutch Female Disability
COMPARE
Venezuelan
Dutch
Female Disability
Female Disability Comparison
Venezuelans
Dutch
11.0%
FEMALE DISABILITY
100.0/ 100
METRIC RATING
23rd/ 347
METRIC RANK
12.9%
FEMALE DISABILITY
0.2/ 100
METRIC RATING
271st/ 347
METRIC RANK
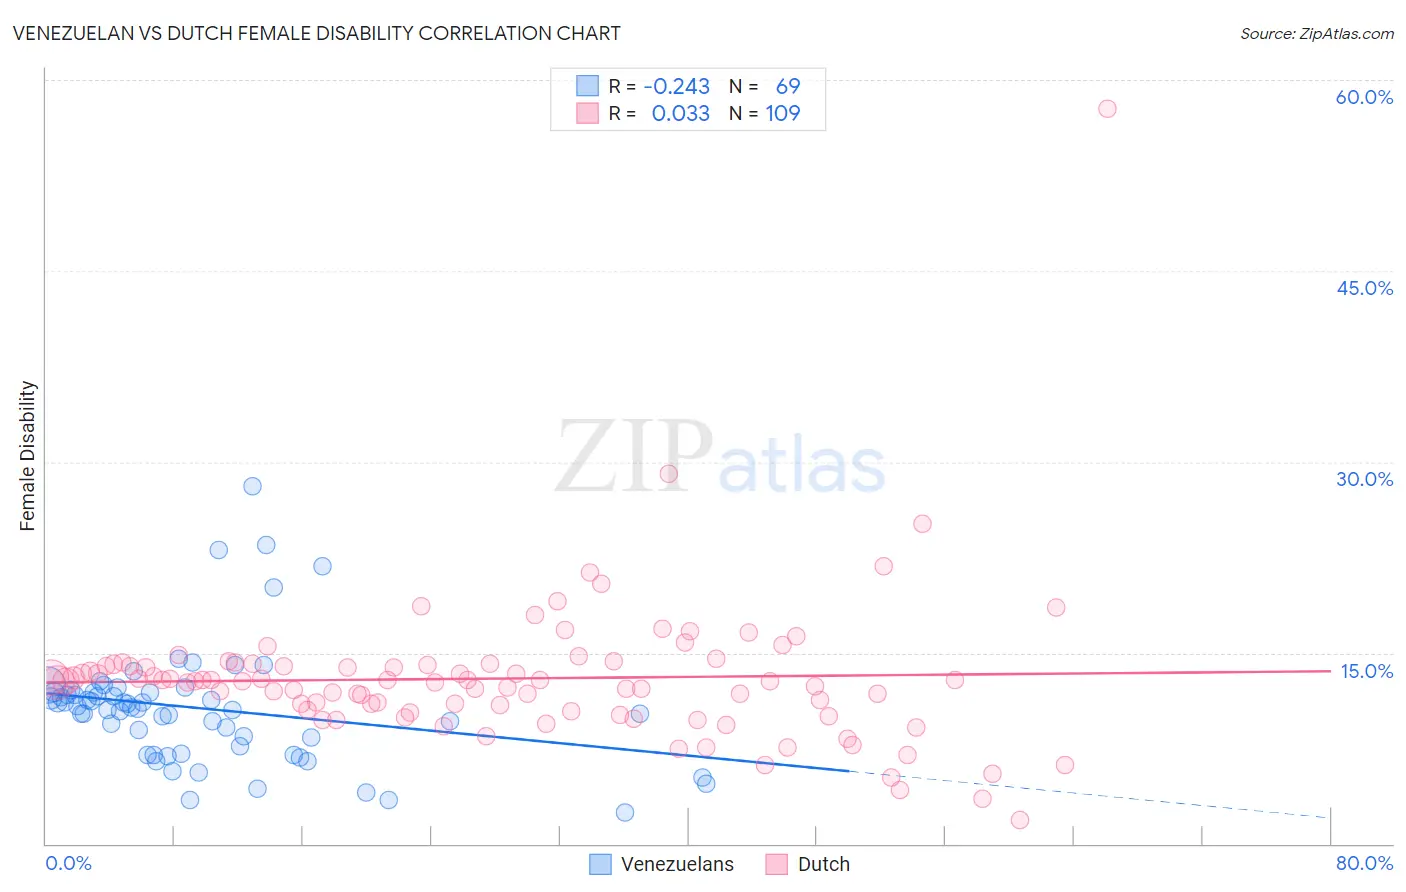
Venezuelan vs Dutch Female Disability Correlation Chart
The statistical analysis conducted on geographies consisting of 306,290,723 people shows a weak negative correlation between the proportion of Venezuelans and percentage of females with a disability in the United States with a correlation coefficient (R) of -0.243 and weighted average of 11.0%. Similarly, the statistical analysis conducted on geographies consisting of 554,147,365 people shows no correlation between the proportion of Dutch and percentage of females with a disability in the United States with a correlation coefficient (R) of 0.033 and weighted average of 12.9%, a difference of 18.0%.
Female Disability Correlation Summary
| Measurement | Venezuelan | Dutch |
| Minimum | 2.5% | 1.9% |
| Maximum | 28.1% | 57.7% |
| Range | 25.6% | 55.9% |
| Mean | 10.6% | 13.0% |
| Median | 10.7% | 12.8% |
| Interquartile 25% (IQ1) | 7.4% | 10.5% |
| Interquartile 75% (IQ3) | 11.9% | 14.1% |
| Interquartile Range (IQR) | 4.5% | 3.7% |
| Standard Deviation (Sample) | 4.6% | 5.9% |
| Standard Deviation (Population) | 4.6% | 5.9% |
Similar Demographics by Female Disability
Demographics Similar to Venezuelans by Female Disability
In terms of female disability, the demographic groups most similar to Venezuelans are Immigrants from Sri Lanka (10.9%, a difference of 0.22%), Asian (10.9%, a difference of 0.35%), Immigrants from Argentina (11.0%, a difference of 0.57%), Immigrants from Asia (11.0%, a difference of 0.59%), and Argentinean (11.0%, a difference of 0.64%).
| Demographics | Rating | Rank | Female Disability |
| Okinawans | 100.0 /100 | #16 | Exceptional 10.8% |
| Indians (Asian) | 100.0 /100 | #17 | Exceptional 10.8% |
| Immigrants | Iran | 100.0 /100 | #18 | Exceptional 10.8% |
| Immigrants | Venezuela | 100.0 /100 | #19 | Exceptional 10.9% |
| Immigrants | Pakistan | 100.0 /100 | #20 | Exceptional 10.9% |
| Asians | 100.0 /100 | #21 | Exceptional 10.9% |
| Immigrants | Sri Lanka | 100.0 /100 | #22 | Exceptional 10.9% |
| Venezuelans | 100.0 /100 | #23 | Exceptional 11.0% |
| Immigrants | Argentina | 100.0 /100 | #24 | Exceptional 11.0% |
| Immigrants | Asia | 100.0 /100 | #25 | Exceptional 11.0% |
| Argentineans | 100.0 /100 | #26 | Exceptional 11.0% |
| Immigrants | Turkey | 100.0 /100 | #27 | Exceptional 11.1% |
| Egyptians | 100.0 /100 | #28 | Exceptional 11.1% |
| Immigrants | Malaysia | 100.0 /100 | #29 | Exceptional 11.1% |
| Turks | 100.0 /100 | #30 | Exceptional 11.1% |
Demographics Similar to Dutch by Female Disability
In terms of female disability, the demographic groups most similar to Dutch are German (12.9%, a difference of 0.21%), Sioux (12.9%, a difference of 0.23%), Portuguese (13.0%, a difference of 0.35%), Cheyenne (13.0%, a difference of 0.40%), and Immigrants from Dominica (13.0%, a difference of 0.45%).
| Demographics | Rating | Rank | Female Disability |
| Alaska Natives | 0.6 /100 | #264 | Tragic 12.8% |
| West Indians | 0.5 /100 | #265 | Tragic 12.8% |
| Finns | 0.4 /100 | #266 | Tragic 12.8% |
| Senegalese | 0.4 /100 | #267 | Tragic 12.8% |
| Immigrants | Laos | 0.4 /100 | #268 | Tragic 12.8% |
| Indonesians | 0.4 /100 | #269 | Tragic 12.8% |
| Immigrants | Liberia | 0.3 /100 | #270 | Tragic 12.9% |
| Dutch | 0.2 /100 | #271 | Tragic 12.9% |
| Germans | 0.1 /100 | #272 | Tragic 12.9% |
| Sioux | 0.1 /100 | #273 | Tragic 12.9% |
| Portuguese | 0.1 /100 | #274 | Tragic 13.0% |
| Cheyenne | 0.1 /100 | #275 | Tragic 13.0% |
| Immigrants | Dominica | 0.1 /100 | #276 | Tragic 13.0% |
| Spanish | 0.1 /100 | #277 | Tragic 13.0% |
| Scottish | 0.1 /100 | #278 | Tragic 13.0% |