Icelander vs Dutch Female Disability
COMPARE
Icelander
Dutch
Female Disability
Female Disability Comparison
Icelanders
Dutch
12.0%
FEMALE DISABILITY
80.7/ 100
METRIC RATING
151st/ 347
METRIC RANK
12.9%
FEMALE DISABILITY
0.2/ 100
METRIC RATING
271st/ 347
METRIC RANK
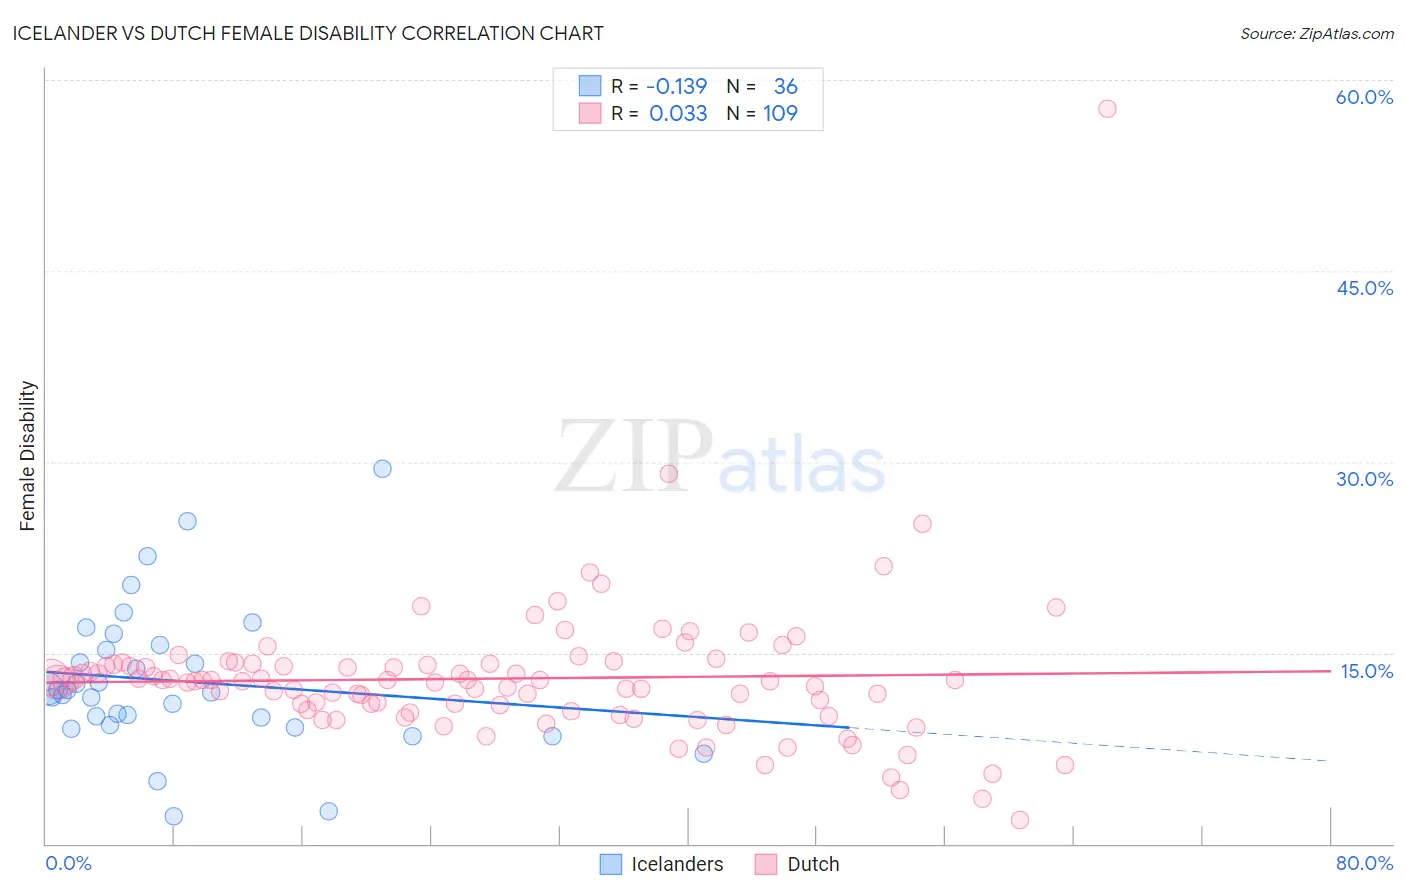
Icelander vs Dutch Female Disability Correlation Chart
The statistical analysis conducted on geographies consisting of 159,642,732 people shows a poor negative correlation between the proportion of Icelanders and percentage of females with a disability in the United States with a correlation coefficient (R) of -0.139 and weighted average of 12.0%. Similarly, the statistical analysis conducted on geographies consisting of 554,147,365 people shows no correlation between the proportion of Dutch and percentage of females with a disability in the United States with a correlation coefficient (R) of 0.033 and weighted average of 12.9%, a difference of 7.4%.
Female Disability Correlation Summary
| Measurement | Icelander | Dutch |
| Minimum | 2.2% | 1.9% |
| Maximum | 29.5% | 57.7% |
| Range | 27.3% | 55.9% |
| Mean | 12.8% | 13.0% |
| Median | 12.0% | 12.8% |
| Interquartile 25% (IQ1) | 9.6% | 10.5% |
| Interquartile 75% (IQ3) | 15.4% | 14.1% |
| Interquartile Range (IQR) | 5.8% | 3.7% |
| Standard Deviation (Sample) | 5.7% | 5.9% |
| Standard Deviation (Population) | 5.6% | 5.9% |
Similar Demographics by Female Disability
Demographics Similar to Icelanders by Female Disability
In terms of female disability, the demographic groups most similar to Icelanders are Immigrants from Moldova (12.0%, a difference of 0.040%), Greek (12.0%, a difference of 0.080%), Immigrants from Scotland (12.0%, a difference of 0.090%), Sudanese (12.0%, a difference of 0.090%), and Immigrants from Kenya (12.0%, a difference of 0.15%).
| Demographics | Rating | Rank | Female Disability |
| Immigrants | Austria | 87.9 /100 | #144 | Excellent 12.0% |
| Estonians | 87.8 /100 | #145 | Excellent 12.0% |
| Pakistanis | 84.6 /100 | #146 | Excellent 12.0% |
| Nigerians | 84.0 /100 | #147 | Excellent 12.0% |
| Immigrants | Kenya | 83.1 /100 | #148 | Excellent 12.0% |
| Greeks | 82.0 /100 | #149 | Excellent 12.0% |
| Immigrants | Moldova | 81.4 /100 | #150 | Excellent 12.0% |
| Icelanders | 80.7 /100 | #151 | Excellent 12.0% |
| Immigrants | Scotland | 79.3 /100 | #152 | Good 12.0% |
| Sudanese | 79.1 /100 | #153 | Good 12.0% |
| Syrians | 76.9 /100 | #154 | Good 12.1% |
| Ghanaians | 76.6 /100 | #155 | Good 12.1% |
| Moroccans | 72.9 /100 | #156 | Good 12.1% |
| Danes | 72.5 /100 | #157 | Good 12.1% |
| Immigrants | Middle Africa | 72.4 /100 | #158 | Good 12.1% |
Demographics Similar to Dutch by Female Disability
In terms of female disability, the demographic groups most similar to Dutch are German (12.9%, a difference of 0.21%), Sioux (12.9%, a difference of 0.23%), Portuguese (13.0%, a difference of 0.35%), Cheyenne (13.0%, a difference of 0.40%), and Immigrants from Dominica (13.0%, a difference of 0.45%).
| Demographics | Rating | Rank | Female Disability |
| Alaska Natives | 0.6 /100 | #264 | Tragic 12.8% |
| West Indians | 0.5 /100 | #265 | Tragic 12.8% |
| Finns | 0.4 /100 | #266 | Tragic 12.8% |
| Senegalese | 0.4 /100 | #267 | Tragic 12.8% |
| Immigrants | Laos | 0.4 /100 | #268 | Tragic 12.8% |
| Indonesians | 0.4 /100 | #269 | Tragic 12.8% |
| Immigrants | Liberia | 0.3 /100 | #270 | Tragic 12.9% |
| Dutch | 0.2 /100 | #271 | Tragic 12.9% |
| Germans | 0.1 /100 | #272 | Tragic 12.9% |
| Sioux | 0.1 /100 | #273 | Tragic 12.9% |
| Portuguese | 0.1 /100 | #274 | Tragic 13.0% |
| Cheyenne | 0.1 /100 | #275 | Tragic 13.0% |
| Immigrants | Dominica | 0.1 /100 | #276 | Tragic 13.0% |
| Spanish | 0.1 /100 | #277 | Tragic 13.0% |
| Scottish | 0.1 /100 | #278 | Tragic 13.0% |