Mexican vs British Disability Age Under 5
COMPARE
Mexican
British
Disability Age Under 5
Disability Age Under 5 Comparison
Mexicans
British
1.3%
DISABILITY AGE UNDER 5
20.8/ 100
METRIC RATING
208th/ 347
METRIC RANK
1.5%
DISABILITY AGE UNDER 5
0.0/ 100
METRIC RATING
280th/ 347
METRIC RANK
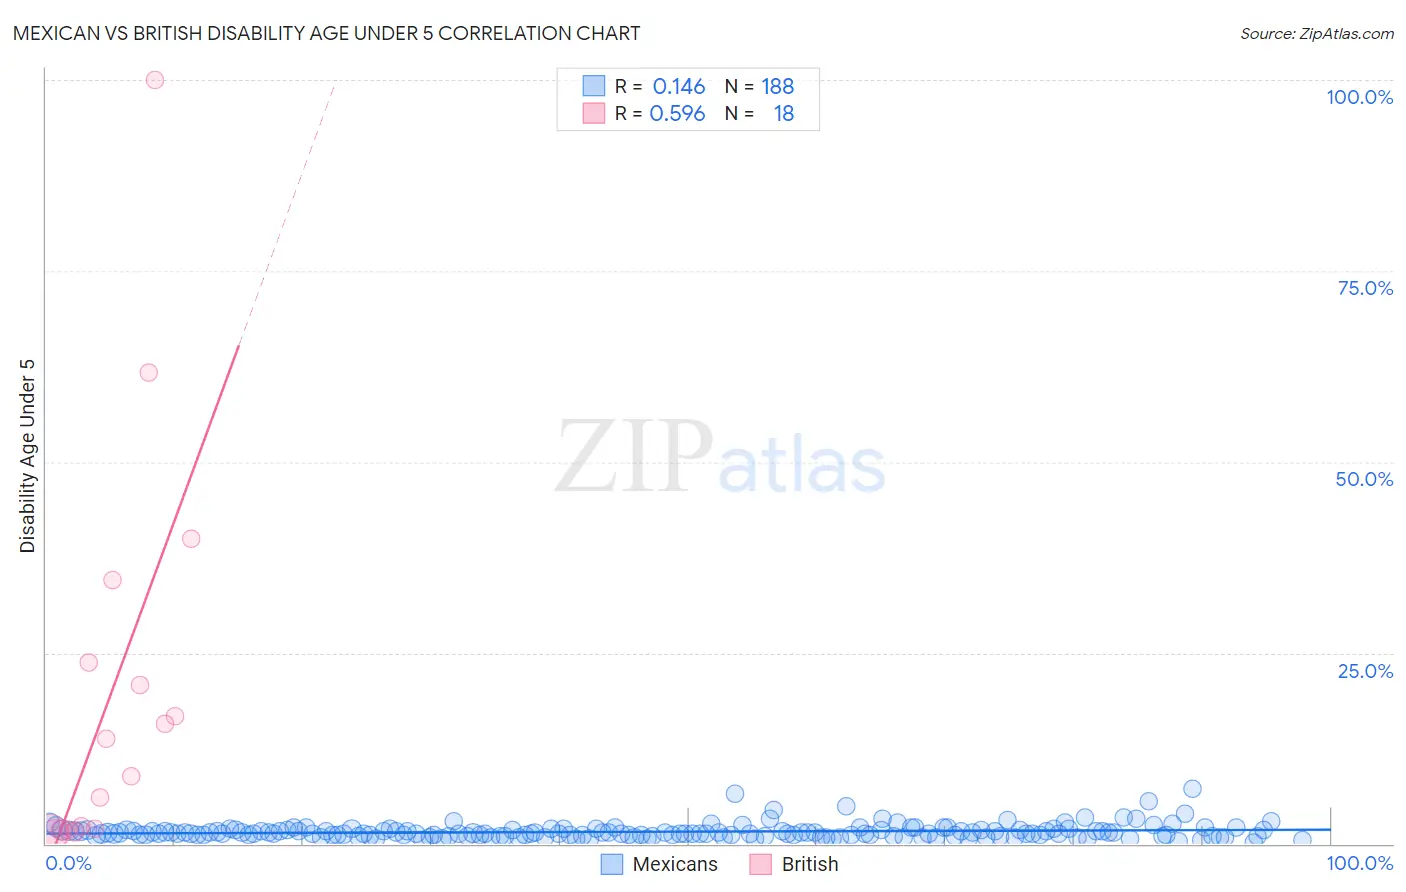
Mexican vs British Disability Age Under 5 Correlation Chart
The statistical analysis conducted on geographies consisting of 261,142,373 people shows a poor positive correlation between the proportion of Mexicans and percentage of population with a disability under the age of 5 in the United States with a correlation coefficient (R) of 0.146 and weighted average of 1.3%. Similarly, the statistical analysis conducted on geographies consisting of 252,245,958 people shows a substantial positive correlation between the proportion of British and percentage of population with a disability under the age of 5 in the United States with a correlation coefficient (R) of 0.596 and weighted average of 1.5%, a difference of 16.4%.
Disability Age Under 5 Correlation Summary
| Measurement | Mexican | British |
| Minimum | 0.20% | 1.3% |
| Maximum | 7.3% | 100.0% |
| Range | 7.1% | 98.7% |
| Mean | 1.6% | 19.7% |
| Median | 1.3% | 11.3% |
| Interquartile 25% (IQ1) | 1.1% | 1.8% |
| Interquartile 75% (IQ3) | 1.8% | 23.7% |
| Interquartile Range (IQR) | 0.72% | 21.9% |
| Standard Deviation (Sample) | 0.95% | 26.0% |
| Standard Deviation (Population) | 0.95% | 25.3% |
Similar Demographics by Disability Age Under 5
Demographics Similar to Mexicans by Disability Age Under 5
In terms of disability age under 5, the demographic groups most similar to Mexicans are Nigerian (1.3%, a difference of 0.060%), Bulgarian (1.3%, a difference of 0.18%), Pakistani (1.3%, a difference of 0.19%), Immigrants from Poland (1.3%, a difference of 0.21%), and Romanian (1.3%, a difference of 0.23%).
| Demographics | Rating | Rank | Disability Age Under 5 |
| Immigrants | Italy | 25.4 /100 | #201 | Fair 1.3% |
| Arapaho | 24.1 /100 | #202 | Fair 1.3% |
| Liberians | 24.0 /100 | #203 | Fair 1.3% |
| Immigrants | Europe | 23.6 /100 | #204 | Fair 1.3% |
| Romanians | 22.5 /100 | #205 | Fair 1.3% |
| Immigrants | Poland | 22.4 /100 | #206 | Fair 1.3% |
| Nigerians | 21.2 /100 | #207 | Fair 1.3% |
| Mexicans | 20.8 /100 | #208 | Fair 1.3% |
| Bulgarians | 19.5 /100 | #209 | Poor 1.3% |
| Pakistanis | 19.4 /100 | #210 | Poor 1.3% |
| Immigrants | Greece | 19.1 /100 | #211 | Poor 1.3% |
| Chileans | 18.8 /100 | #212 | Poor 1.3% |
| Immigrants | Sudan | 18.7 /100 | #213 | Poor 1.3% |
| Immigrants | Chile | 17.2 /100 | #214 | Poor 1.3% |
| Syrians | 16.1 /100 | #215 | Poor 1.3% |
Demographics Similar to British by Disability Age Under 5
In terms of disability age under 5, the demographic groups most similar to British are Danish (1.5%, a difference of 0.76%), Kiowa (1.5%, a difference of 0.77%), Canadian (1.5%, a difference of 0.85%), Greek (1.5%, a difference of 1.6%), and Czechoslovakian (1.5%, a difference of 1.7%).
| Demographics | Rating | Rank | Disability Age Under 5 |
| Alaskan Athabascans | 0.1 /100 | #273 | Tragic 1.5% |
| Iroquois | 0.0 /100 | #274 | Tragic 1.5% |
| Brazilians | 0.0 /100 | #275 | Tragic 1.5% |
| Greeks | 0.0 /100 | #276 | Tragic 1.5% |
| Canadians | 0.0 /100 | #277 | Tragic 1.5% |
| Kiowa | 0.0 /100 | #278 | Tragic 1.5% |
| Danes | 0.0 /100 | #279 | Tragic 1.5% |
| British | 0.0 /100 | #280 | Tragic 1.5% |
| Czechoslovakians | 0.0 /100 | #281 | Tragic 1.5% |
| Cheyenne | 0.0 /100 | #282 | Tragic 1.5% |
| Delaware | 0.0 /100 | #283 | Tragic 1.5% |
| Europeans | 0.0 /100 | #284 | Tragic 1.5% |
| Croatians | 0.0 /100 | #285 | Tragic 1.5% |
| Tlingit-Haida | 0.0 /100 | #286 | Tragic 1.5% |
| Scandinavians | 0.0 /100 | #287 | Tragic 1.5% |