Choctaw vs Alsatian Cognitive Disability
COMPARE
Choctaw
Alsatian
Cognitive Disability
Cognitive Disability Comparison
Choctaw
Alsatians
18.4%
COGNITIVE DISABILITY
0.0/ 100
METRIC RATING
310th/ 347
METRIC RANK
17.7%
COGNITIVE DISABILITY
4.5/ 100
METRIC RATING
223rd/ 347
METRIC RANK
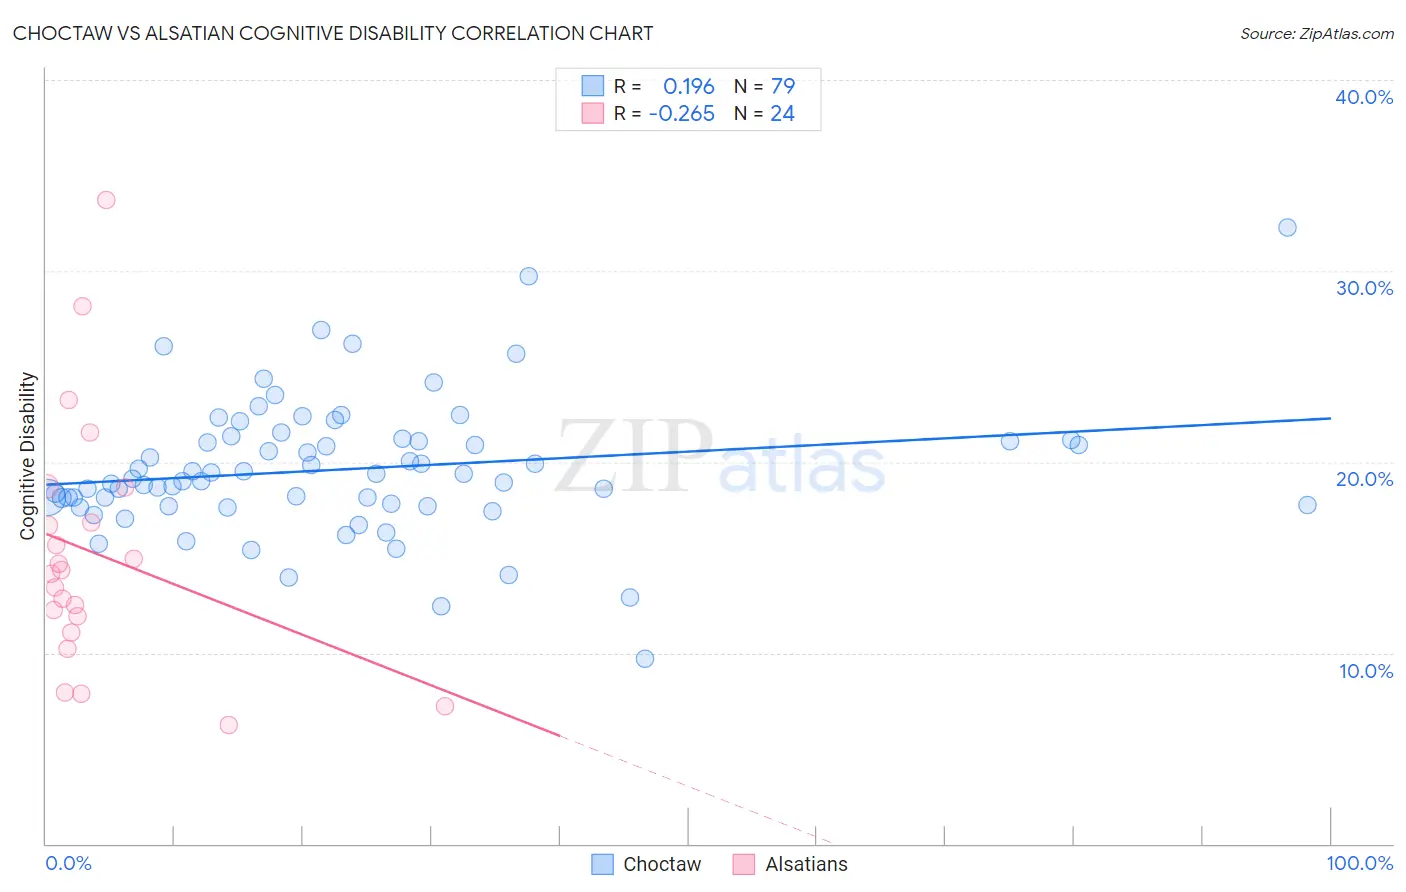
Choctaw vs Alsatian Cognitive Disability Correlation Chart
The statistical analysis conducted on geographies consisting of 269,665,834 people shows a poor positive correlation between the proportion of Choctaw and percentage of population with cognitive disability in the United States with a correlation coefficient (R) of 0.196 and weighted average of 18.4%. Similarly, the statistical analysis conducted on geographies consisting of 82,682,247 people shows a weak negative correlation between the proportion of Alsatians and percentage of population with cognitive disability in the United States with a correlation coefficient (R) of -0.265 and weighted average of 17.7%, a difference of 4.4%.
Cognitive Disability Correlation Summary
| Measurement | Choctaw | Alsatian |
| Minimum | 9.7% | 6.2% |
| Maximum | 32.3% | 33.7% |
| Range | 22.6% | 27.5% |
| Mean | 19.6% | 15.2% |
| Median | 19.1% | 14.3% |
| Interquartile 25% (IQ1) | 17.8% | 11.5% |
| Interquartile 75% (IQ3) | 21.1% | 17.7% |
| Interquartile Range (IQR) | 3.4% | 6.2% |
| Standard Deviation (Sample) | 3.6% | 6.5% |
| Standard Deviation (Population) | 3.5% | 6.4% |
Similar Demographics by Cognitive Disability
Demographics Similar to Choctaw by Cognitive Disability
In terms of cognitive disability, the demographic groups most similar to Choctaw are Hmong (18.4%, a difference of 0.030%), Chickasaw (18.5%, a difference of 0.31%), Immigrants from Eastern Africa (18.4%, a difference of 0.37%), Immigrants from Western Africa (18.4%, a difference of 0.41%), and Yaqui (18.5%, a difference of 0.42%).
| Demographics | Rating | Rank | Cognitive Disability |
| Immigrants | Kenya | 0.0 /100 | #303 | Tragic 18.3% |
| Immigrants | Eritrea | 0.0 /100 | #304 | Tragic 18.3% |
| Colville | 0.0 /100 | #305 | Tragic 18.3% |
| Seminole | 0.0 /100 | #306 | Tragic 18.3% |
| Ugandans | 0.0 /100 | #307 | Tragic 18.3% |
| Immigrants | Western Africa | 0.0 /100 | #308 | Tragic 18.4% |
| Immigrants | Eastern Africa | 0.0 /100 | #309 | Tragic 18.4% |
| Choctaw | 0.0 /100 | #310 | Tragic 18.4% |
| Hmong | 0.0 /100 | #311 | Tragic 18.4% |
| Chickasaw | 0.0 /100 | #312 | Tragic 18.5% |
| Yaqui | 0.0 /100 | #313 | Tragic 18.5% |
| Sub-Saharan Africans | 0.0 /100 | #314 | Tragic 18.5% |
| Immigrants | Dominica | 0.0 /100 | #315 | Tragic 18.6% |
| Immigrants | Middle Africa | 0.0 /100 | #316 | Tragic 18.6% |
| Liberians | 0.0 /100 | #317 | Tragic 18.6% |
Demographics Similar to Alsatians by Cognitive Disability
In terms of cognitive disability, the demographic groups most similar to Alsatians are Central American (17.7%, a difference of 0.010%), Fijian (17.7%, a difference of 0.19%), Vietnamese (17.7%, a difference of 0.20%), Moroccan (17.6%, a difference of 0.21%), and Zimbabwean (17.6%, a difference of 0.22%).
| Demographics | Rating | Rank | Cognitive Disability |
| Okinawans | 6.8 /100 | #216 | Tragic 17.6% |
| Salvadorans | 6.7 /100 | #217 | Tragic 17.6% |
| Icelanders | 6.4 /100 | #218 | Tragic 17.6% |
| Immigrants | Sierra Leone | 6.3 /100 | #219 | Tragic 17.6% |
| Zimbabweans | 6.1 /100 | #220 | Tragic 17.6% |
| Moroccans | 5.9 /100 | #221 | Tragic 17.6% |
| Central Americans | 4.5 /100 | #222 | Tragic 17.7% |
| Alsatians | 4.5 /100 | #223 | Tragic 17.7% |
| Fijians | 3.4 /100 | #224 | Tragic 17.7% |
| Vietnamese | 3.4 /100 | #225 | Tragic 17.7% |
| Marshallese | 2.7 /100 | #226 | Tragic 17.7% |
| Immigrants | St. Vincent and the Grenadines | 2.6 /100 | #227 | Tragic 17.7% |
| Immigrants | Central America | 2.3 /100 | #228 | Tragic 17.7% |
| Immigrants | Guatemala | 2.2 /100 | #229 | Tragic 17.7% |
| Mongolians | 2.2 /100 | #230 | Tragic 17.7% |