Immigrants from Japan vs Alsatian Cognitive Disability
COMPARE
Immigrants from Japan
Alsatian
Cognitive Disability
Cognitive Disability Comparison
Immigrants from Japan
Alsatians
16.9%
COGNITIVE DISABILITY
96.2/ 100
METRIC RATING
117th/ 347
METRIC RANK
17.7%
COGNITIVE DISABILITY
4.5/ 100
METRIC RATING
223rd/ 347
METRIC RANK
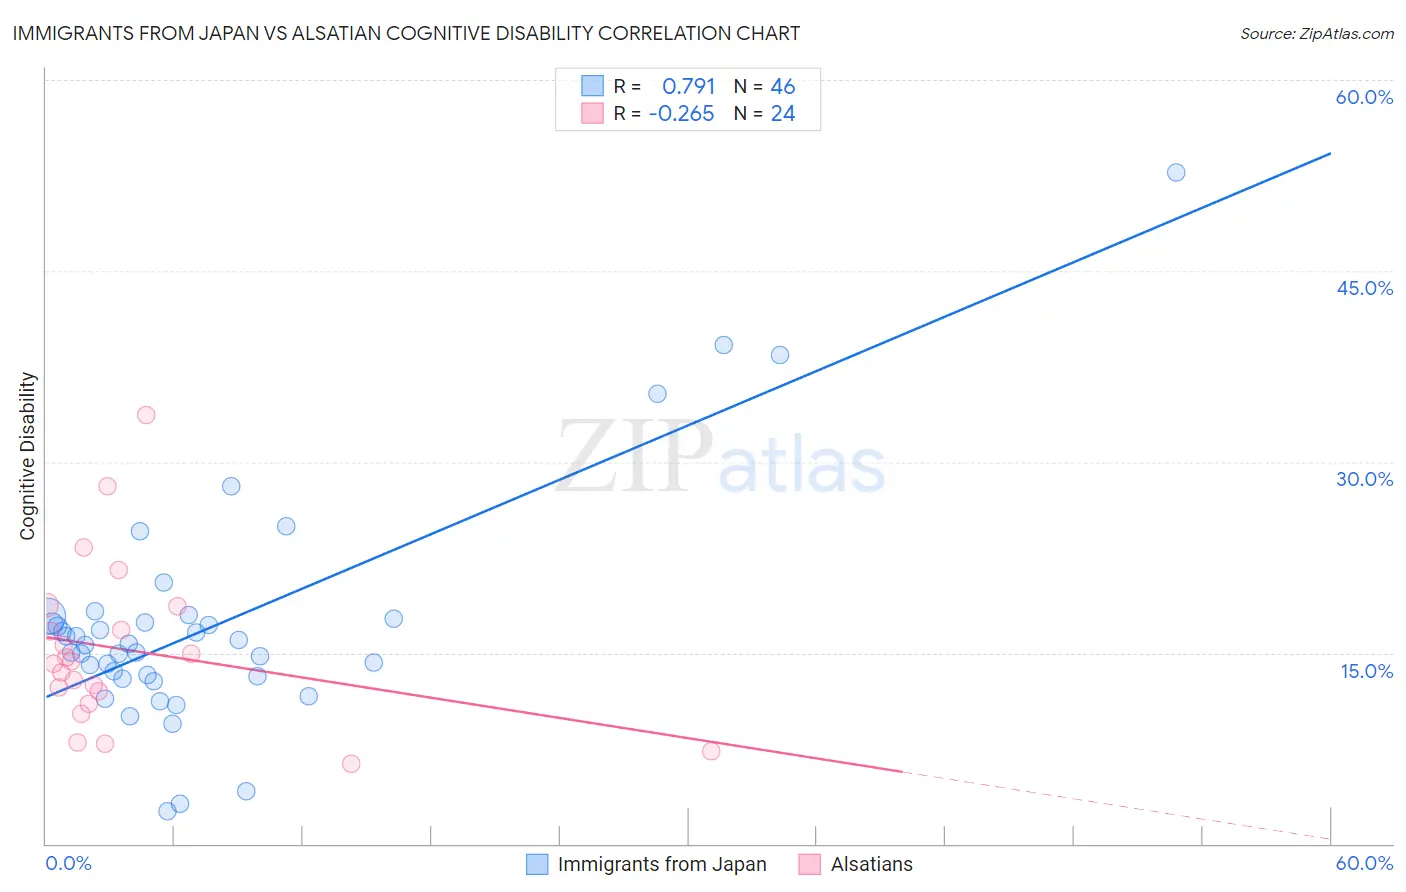
Immigrants from Japan vs Alsatian Cognitive Disability Correlation Chart
The statistical analysis conducted on geographies consisting of 340,148,832 people shows a strong positive correlation between the proportion of Immigrants from Japan and percentage of population with cognitive disability in the United States with a correlation coefficient (R) of 0.791 and weighted average of 16.9%. Similarly, the statistical analysis conducted on geographies consisting of 82,682,247 people shows a weak negative correlation between the proportion of Alsatians and percentage of population with cognitive disability in the United States with a correlation coefficient (R) of -0.265 and weighted average of 17.7%, a difference of 4.6%.
Cognitive Disability Correlation Summary
| Measurement | Immigrants from Japan | Alsatian |
| Minimum | 2.6% | 6.2% |
| Maximum | 52.8% | 33.7% |
| Range | 50.2% | 27.5% |
| Mean | 17.2% | 15.2% |
| Median | 15.7% | 14.3% |
| Interquartile 25% (IQ1) | 13.1% | 11.5% |
| Interquartile 75% (IQ3) | 17.7% | 17.7% |
| Interquartile Range (IQR) | 4.6% | 6.2% |
| Standard Deviation (Sample) | 9.1% | 6.5% |
| Standard Deviation (Population) | 9.0% | 6.4% |
Similar Demographics by Cognitive Disability
Demographics Similar to Immigrants from Japan by Cognitive Disability
In terms of cognitive disability, the demographic groups most similar to Immigrants from Japan are Immigrants from Denmark (16.9%, a difference of 0.010%), Inupiat (16.9%, a difference of 0.050%), South African (16.9%, a difference of 0.13%), Yup'ik (16.9%, a difference of 0.15%), and Korean (16.8%, a difference of 0.20%).
| Demographics | Rating | Rank | Cognitive Disability |
| Arapaho | 97.3 /100 | #110 | Exceptional 16.8% |
| Uruguayans | 97.2 /100 | #111 | Exceptional 16.8% |
| Indians (Asian) | 97.2 /100 | #112 | Exceptional 16.8% |
| Immigrants | Sri Lanka | 97.1 /100 | #113 | Exceptional 16.8% |
| Koreans | 97.1 /100 | #114 | Exceptional 16.8% |
| Yup'ik | 96.9 /100 | #115 | Exceptional 16.9% |
| Inupiat | 96.5 /100 | #116 | Exceptional 16.9% |
| Immigrants | Japan | 96.2 /100 | #117 | Exceptional 16.9% |
| Immigrants | Denmark | 96.2 /100 | #118 | Exceptional 16.9% |
| South Africans | 95.5 /100 | #119 | Exceptional 16.9% |
| Scottish | 95.0 /100 | #120 | Exceptional 16.9% |
| Immigrants | China | 94.9 /100 | #121 | Exceptional 16.9% |
| Immigrants | Western Europe | 94.8 /100 | #122 | Exceptional 16.9% |
| Portuguese | 94.7 /100 | #123 | Exceptional 16.9% |
| Turks | 94.5 /100 | #124 | Exceptional 16.9% |
Demographics Similar to Alsatians by Cognitive Disability
In terms of cognitive disability, the demographic groups most similar to Alsatians are Central American (17.7%, a difference of 0.010%), Fijian (17.7%, a difference of 0.19%), Vietnamese (17.7%, a difference of 0.20%), Moroccan (17.6%, a difference of 0.21%), and Zimbabwean (17.6%, a difference of 0.22%).
| Demographics | Rating | Rank | Cognitive Disability |
| Okinawans | 6.8 /100 | #216 | Tragic 17.6% |
| Salvadorans | 6.7 /100 | #217 | Tragic 17.6% |
| Icelanders | 6.4 /100 | #218 | Tragic 17.6% |
| Immigrants | Sierra Leone | 6.3 /100 | #219 | Tragic 17.6% |
| Zimbabweans | 6.1 /100 | #220 | Tragic 17.6% |
| Moroccans | 5.9 /100 | #221 | Tragic 17.6% |
| Central Americans | 4.5 /100 | #222 | Tragic 17.7% |
| Alsatians | 4.5 /100 | #223 | Tragic 17.7% |
| Fijians | 3.4 /100 | #224 | Tragic 17.7% |
| Vietnamese | 3.4 /100 | #225 | Tragic 17.7% |
| Marshallese | 2.7 /100 | #226 | Tragic 17.7% |
| Immigrants | St. Vincent and the Grenadines | 2.6 /100 | #227 | Tragic 17.7% |
| Immigrants | Central America | 2.3 /100 | #228 | Tragic 17.7% |
| Immigrants | Guatemala | 2.2 /100 | #229 | Tragic 17.7% |
| Mongolians | 2.2 /100 | #230 | Tragic 17.7% |