Slovene vs Alsatian Cognitive Disability
COMPARE
Slovene
Alsatian
Cognitive Disability
Cognitive Disability Comparison
Slovenes
Alsatians
16.5%
COGNITIVE DISABILITY
99.9/ 100
METRIC RATING
37th/ 347
METRIC RANK
17.7%
COGNITIVE DISABILITY
4.5/ 100
METRIC RATING
223rd/ 347
METRIC RANK
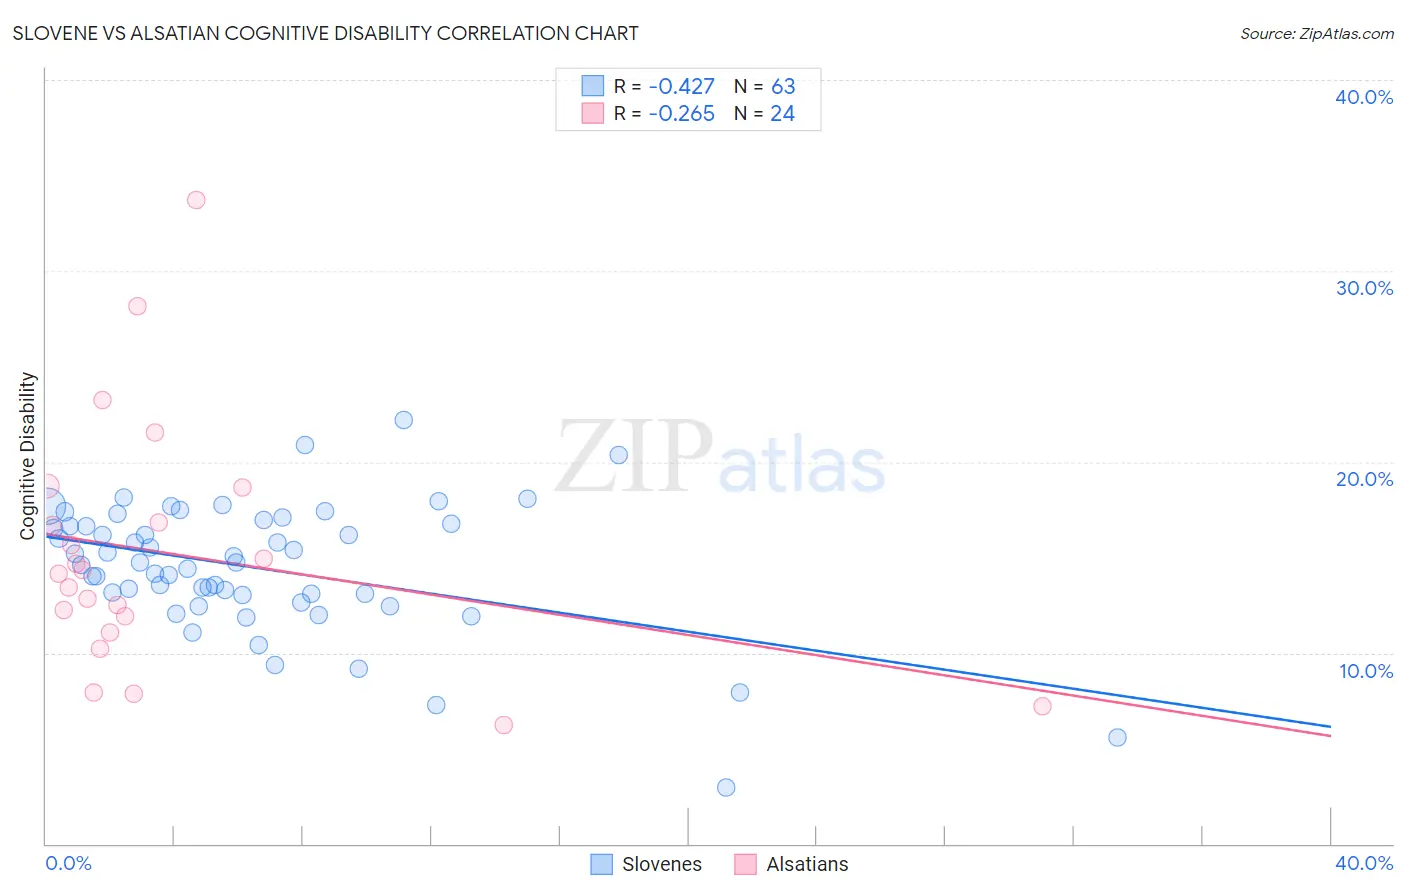
Slovene vs Alsatian Cognitive Disability Correlation Chart
The statistical analysis conducted on geographies consisting of 261,350,780 people shows a moderate negative correlation between the proportion of Slovenes and percentage of population with cognitive disability in the United States with a correlation coefficient (R) of -0.427 and weighted average of 16.5%. Similarly, the statistical analysis conducted on geographies consisting of 82,682,247 people shows a weak negative correlation between the proportion of Alsatians and percentage of population with cognitive disability in the United States with a correlation coefficient (R) of -0.265 and weighted average of 17.7%, a difference of 7.3%.
Cognitive Disability Correlation Summary
| Measurement | Slovene | Alsatian |
| Minimum | 2.9% | 6.2% |
| Maximum | 22.2% | 33.7% |
| Range | 19.2% | 27.5% |
| Mean | 14.4% | 15.2% |
| Median | 14.7% | 14.3% |
| Interquartile 25% (IQ1) | 13.0% | 11.5% |
| Interquartile 75% (IQ3) | 16.8% | 17.7% |
| Interquartile Range (IQR) | 3.8% | 6.2% |
| Standard Deviation (Sample) | 3.4% | 6.5% |
| Standard Deviation (Population) | 3.4% | 6.4% |
Similar Demographics by Cognitive Disability
Demographics Similar to Slovenes by Cognitive Disability
In terms of cognitive disability, the demographic groups most similar to Slovenes are Immigrants from Eastern Europe (16.5%, a difference of 0.020%), Bolivian (16.5%, a difference of 0.090%), Immigrants from Belarus (16.5%, a difference of 0.10%), Cuban (16.5%, a difference of 0.11%), and Hungarian (16.5%, a difference of 0.12%).
| Demographics | Rating | Rank | Cognitive Disability |
| Czechs | 99.9 /100 | #30 | Exceptional 16.4% |
| Immigrants | Romania | 99.9 /100 | #31 | Exceptional 16.4% |
| Immigrants | Israel | 99.9 /100 | #32 | Exceptional 16.4% |
| Italians | 99.9 /100 | #33 | Exceptional 16.4% |
| Russians | 99.9 /100 | #34 | Exceptional 16.4% |
| Slovaks | 99.9 /100 | #35 | Exceptional 16.4% |
| Greeks | 99.9 /100 | #36 | Exceptional 16.4% |
| Slovenes | 99.9 /100 | #37 | Exceptional 16.5% |
| Immigrants | Eastern Europe | 99.9 /100 | #38 | Exceptional 16.5% |
| Bolivians | 99.9 /100 | #39 | Exceptional 16.5% |
| Immigrants | Belarus | 99.9 /100 | #40 | Exceptional 16.5% |
| Cubans | 99.9 /100 | #41 | Exceptional 16.5% |
| Hungarians | 99.9 /100 | #42 | Exceptional 16.5% |
| Immigrants | Canada | 99.8 /100 | #43 | Exceptional 16.5% |
| Macedonians | 99.8 /100 | #44 | Exceptional 16.5% |
Demographics Similar to Alsatians by Cognitive Disability
In terms of cognitive disability, the demographic groups most similar to Alsatians are Central American (17.7%, a difference of 0.010%), Fijian (17.7%, a difference of 0.19%), Vietnamese (17.7%, a difference of 0.20%), Moroccan (17.6%, a difference of 0.21%), and Zimbabwean (17.6%, a difference of 0.22%).
| Demographics | Rating | Rank | Cognitive Disability |
| Okinawans | 6.8 /100 | #216 | Tragic 17.6% |
| Salvadorans | 6.7 /100 | #217 | Tragic 17.6% |
| Icelanders | 6.4 /100 | #218 | Tragic 17.6% |
| Immigrants | Sierra Leone | 6.3 /100 | #219 | Tragic 17.6% |
| Zimbabweans | 6.1 /100 | #220 | Tragic 17.6% |
| Moroccans | 5.9 /100 | #221 | Tragic 17.6% |
| Central Americans | 4.5 /100 | #222 | Tragic 17.7% |
| Alsatians | 4.5 /100 | #223 | Tragic 17.7% |
| Fijians | 3.4 /100 | #224 | Tragic 17.7% |
| Vietnamese | 3.4 /100 | #225 | Tragic 17.7% |
| Marshallese | 2.7 /100 | #226 | Tragic 17.7% |
| Immigrants | St. Vincent and the Grenadines | 2.6 /100 | #227 | Tragic 17.7% |
| Immigrants | Central America | 2.3 /100 | #228 | Tragic 17.7% |
| Immigrants | Guatemala | 2.2 /100 | #229 | Tragic 17.7% |
| Mongolians | 2.2 /100 | #230 | Tragic 17.7% |