Immigrants from Kuwait vs Immigrants from Iran Male Disability
COMPARE
Immigrants from Kuwait
Immigrants from Iran
Male Disability
Male Disability Comparison
Immigrants from Kuwait
Immigrants from Iran
10.2%
MALE DISABILITY
99.8/ 100
METRIC RATING
38th/ 347
METRIC RANK
9.7%
MALE DISABILITY
100.0/ 100
METRIC RATING
14th/ 347
METRIC RANK
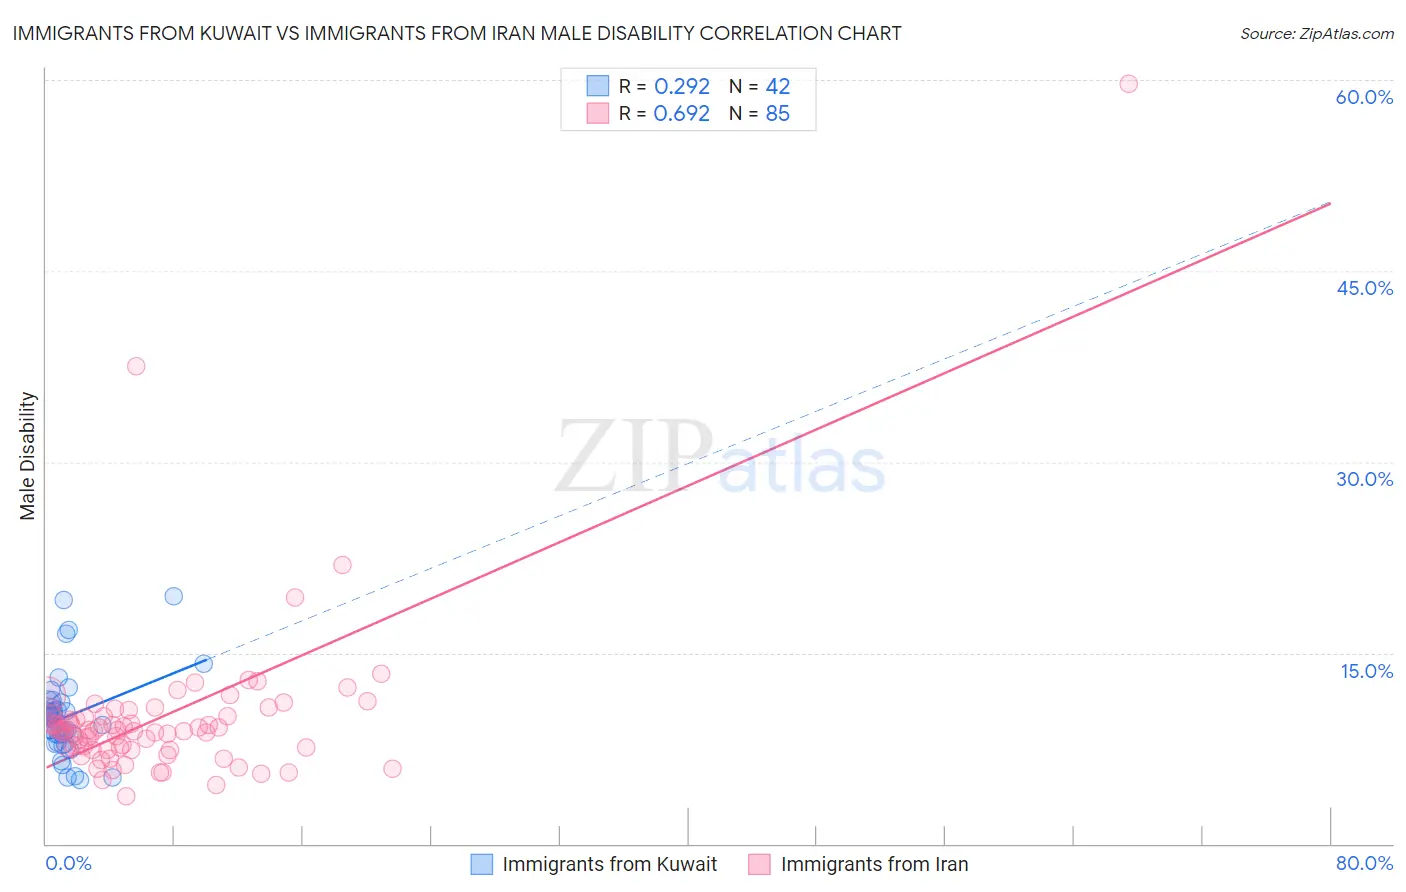
Immigrants from Kuwait vs Immigrants from Iran Male Disability Correlation Chart
The statistical analysis conducted on geographies consisting of 136,916,630 people shows a weak positive correlation between the proportion of Immigrants from Kuwait and percentage of males with a disability in the United States with a correlation coefficient (R) of 0.292 and weighted average of 10.2%. Similarly, the statistical analysis conducted on geographies consisting of 279,892,018 people shows a significant positive correlation between the proportion of Immigrants from Iran and percentage of males with a disability in the United States with a correlation coefficient (R) of 0.692 and weighted average of 9.7%, a difference of 5.8%.
Male Disability Correlation Summary
| Measurement | Immigrants from Kuwait | Immigrants from Iran |
| Minimum | 5.0% | 3.8% |
| Maximum | 19.4% | 59.7% |
| Range | 14.4% | 55.9% |
| Mean | 10.0% | 9.9% |
| Median | 9.7% | 8.9% |
| Interquartile 25% (IQ1) | 7.9% | 7.5% |
| Interquartile 75% (IQ3) | 10.9% | 10.1% |
| Interquartile Range (IQR) | 3.0% | 2.6% |
| Standard Deviation (Sample) | 3.4% | 6.8% |
| Standard Deviation (Population) | 3.3% | 6.8% |
Similar Demographics by Male Disability
Demographics Similar to Immigrants from Kuwait by Male Disability
In terms of male disability, the demographic groups most similar to Immigrants from Kuwait are Afghan (10.2%, a difference of 0.16%), Immigrants from Indonesia (10.2%, a difference of 0.17%), Ethiopian (10.2%, a difference of 0.24%), Immigrants from Argentina (10.2%, a difference of 0.29%), and Immigrants from Nepal (10.3%, a difference of 0.35%).
| Demographics | Rating | Rank | Male Disability |
| Soviet Union | 99.9 /100 | #31 | Exceptional 10.1% |
| Argentineans | 99.9 /100 | #32 | Exceptional 10.1% |
| Immigrants | Ethiopia | 99.9 /100 | #33 | Exceptional 10.2% |
| Immigrants | Turkey | 99.9 /100 | #34 | Exceptional 10.2% |
| Immigrants | Argentina | 99.9 /100 | #35 | Exceptional 10.2% |
| Ethiopians | 99.8 /100 | #36 | Exceptional 10.2% |
| Immigrants | Indonesia | 99.8 /100 | #37 | Exceptional 10.2% |
| Immigrants | Kuwait | 99.8 /100 | #38 | Exceptional 10.2% |
| Afghans | 99.8 /100 | #39 | Exceptional 10.2% |
| Immigrants | Nepal | 99.8 /100 | #40 | Exceptional 10.3% |
| Taiwanese | 99.8 /100 | #41 | Exceptional 10.3% |
| Mongolians | 99.7 /100 | #42 | Exceptional 10.3% |
| Immigrants | Bangladesh | 99.7 /100 | #43 | Exceptional 10.3% |
| Immigrants | El Salvador | 99.7 /100 | #44 | Exceptional 10.3% |
| Turks | 99.7 /100 | #45 | Exceptional 10.3% |
Demographics Similar to Immigrants from Iran by Male Disability
In terms of male disability, the demographic groups most similar to Immigrants from Iran are Iranian (9.7%, a difference of 0.10%), Bolivian (9.6%, a difference of 0.33%), Indian (Asian) (9.7%, a difference of 0.45%), Immigrants from Eastern Asia (9.6%, a difference of 0.56%), and Okinawan (9.8%, a difference of 1.1%).
| Demographics | Rating | Rank | Male Disability |
| Immigrants | Bolivia | 100.0 /100 | #7 | Exceptional 9.5% |
| Immigrants | China | 100.0 /100 | #8 | Exceptional 9.5% |
| Immigrants | Singapore | 100.0 /100 | #9 | Exceptional 9.5% |
| Immigrants | Israel | 100.0 /100 | #10 | Exceptional 9.6% |
| Immigrants | Eastern Asia | 100.0 /100 | #11 | Exceptional 9.6% |
| Bolivians | 100.0 /100 | #12 | Exceptional 9.6% |
| Iranians | 100.0 /100 | #13 | Exceptional 9.7% |
| Immigrants | Iran | 100.0 /100 | #14 | Exceptional 9.7% |
| Indians (Asian) | 100.0 /100 | #15 | Exceptional 9.7% |
| Okinawans | 100.0 /100 | #16 | Exceptional 9.8% |
| Immigrants | Korea | 100.0 /100 | #17 | Exceptional 9.8% |
| Immigrants | Pakistan | 100.0 /100 | #18 | Exceptional 9.8% |
| Immigrants | Sri Lanka | 100.0 /100 | #19 | Exceptional 10.0% |
| Asians | 100.0 /100 | #20 | Exceptional 10.0% |
| Burmese | 100.0 /100 | #21 | Exceptional 10.0% |