Immigrants from Jordan vs Immigrants from France Ambulatory Disability
COMPARE
Immigrants from Jordan
Immigrants from France
Ambulatory Disability
Ambulatory Disability Comparison
Immigrants from Jordan
Immigrants from France
5.7%
AMBULATORY DISABILITY
99.2/ 100
METRIC RATING
81st/ 347
METRIC RANK
5.6%
AMBULATORY DISABILITY
99.7/ 100
METRIC RATING
63rd/ 347
METRIC RANK
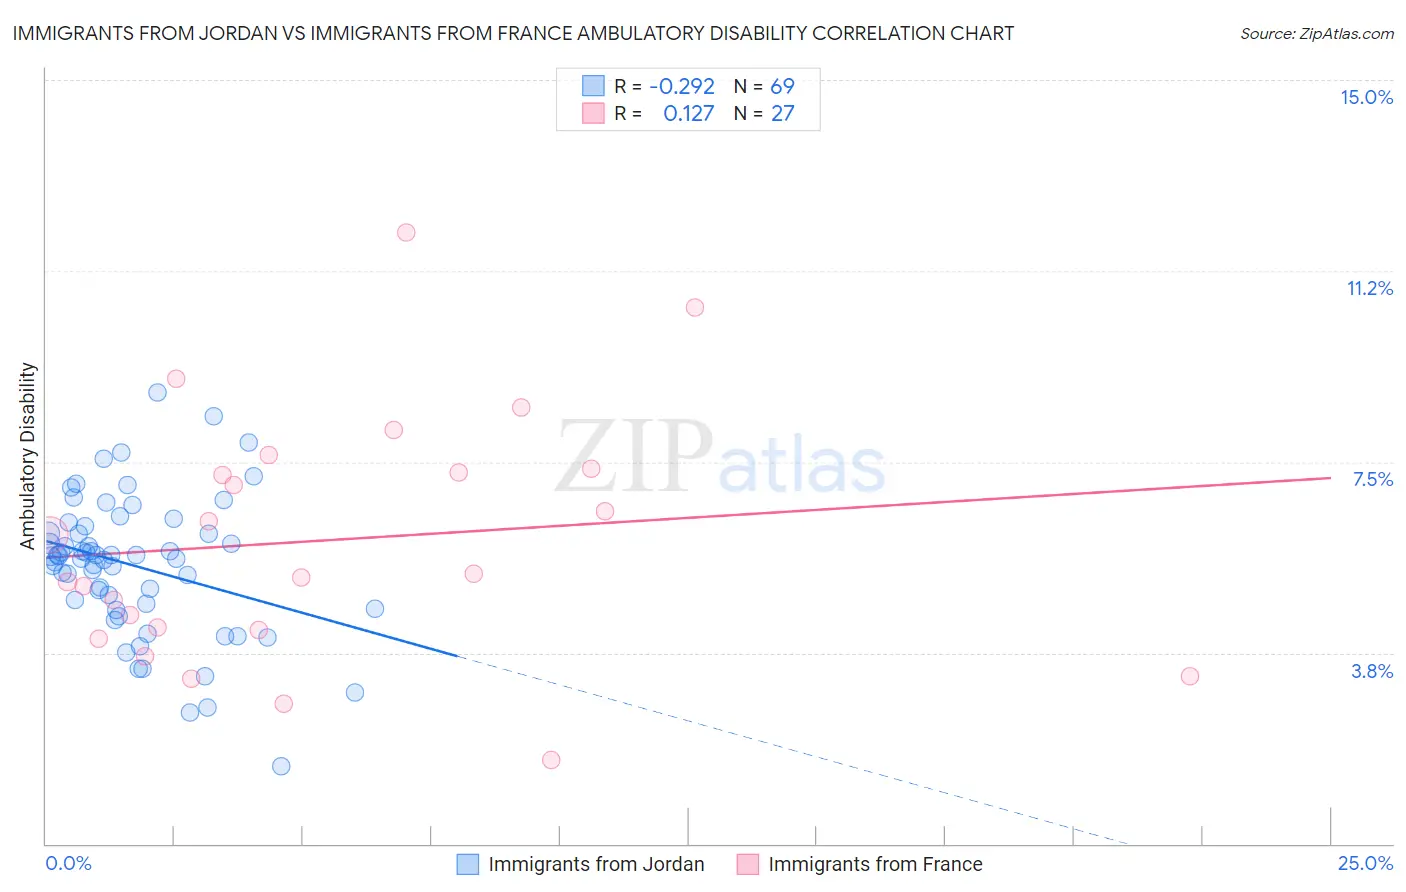
Immigrants from Jordan vs Immigrants from France Ambulatory Disability Correlation Chart
The statistical analysis conducted on geographies consisting of 181,269,756 people shows a weak negative correlation between the proportion of Immigrants from Jordan and percentage of population with ambulatory disability in the United States with a correlation coefficient (R) of -0.292 and weighted average of 5.7%. Similarly, the statistical analysis conducted on geographies consisting of 287,866,791 people shows a poor positive correlation between the proportion of Immigrants from France and percentage of population with ambulatory disability in the United States with a correlation coefficient (R) of 0.127 and weighted average of 5.6%, a difference of 1.5%.
Ambulatory Disability Correlation Summary
| Measurement | Immigrants from Jordan | Immigrants from France |
| Minimum | 1.5% | 1.6% |
| Maximum | 8.9% | 12.0% |
| Range | 7.3% | 10.4% |
| Mean | 5.5% | 6.0% |
| Median | 5.6% | 5.3% |
| Interquartile 25% (IQ1) | 4.7% | 4.2% |
| Interquartile 75% (IQ3) | 6.2% | 7.4% |
| Interquartile Range (IQR) | 1.5% | 3.2% |
| Standard Deviation (Sample) | 1.4% | 2.4% |
| Standard Deviation (Population) | 1.4% | 2.4% |
Demographics Similar to Immigrants from Jordan and Immigrants from France by Ambulatory Disability
In terms of ambulatory disability, the demographic groups most similar to Immigrants from Jordan are Palestinian (5.7%, a difference of 0.0%), Immigrants from Ireland (5.7%, a difference of 0.010%), Somali (5.7%, a difference of 0.14%), Chilean (5.7%, a difference of 0.14%), and Immigrants from Vietnam (5.7%, a difference of 0.16%). Similarly, the demographic groups most similar to Immigrants from France are Immigrants from Spain (5.6%, a difference of 0.12%), Laotian (5.7%, a difference of 0.13%), Immigrants from Switzerland (5.7%, a difference of 0.16%), Israeli (5.7%, a difference of 0.25%), and Immigrants from Uganda (5.7%, a difference of 0.26%).
| Demographics | Rating | Rank | Ambulatory Disability |
| Immigrants | Spain | 99.7 /100 | #62 | Exceptional 5.6% |
| Immigrants | France | 99.7 /100 | #63 | Exceptional 5.6% |
| Laotians | 99.7 /100 | #64 | Exceptional 5.7% |
| Immigrants | Switzerland | 99.7 /100 | #65 | Exceptional 5.7% |
| Israelis | 99.6 /100 | #66 | Exceptional 5.7% |
| Immigrants | Uganda | 99.6 /100 | #67 | Exceptional 5.7% |
| Sri Lankans | 99.6 /100 | #68 | Exceptional 5.7% |
| Peruvians | 99.5 /100 | #69 | Exceptional 5.7% |
| Sierra Leoneans | 99.4 /100 | #70 | Exceptional 5.7% |
| Immigrants | Peru | 99.4 /100 | #71 | Exceptional 5.7% |
| Brazilians | 99.4 /100 | #72 | Exceptional 5.7% |
| Immigrants | Northern Africa | 99.4 /100 | #73 | Exceptional 5.7% |
| Immigrants | Cameroon | 99.4 /100 | #74 | Exceptional 5.7% |
| Immigrants | South Africa | 99.3 /100 | #75 | Exceptional 5.7% |
| Sudanese | 99.3 /100 | #76 | Exceptional 5.7% |
| Immigrants | Vietnam | 99.3 /100 | #77 | Exceptional 5.7% |
| Somalis | 99.2 /100 | #78 | Exceptional 5.7% |
| Chileans | 99.2 /100 | #79 | Exceptional 5.7% |
| Immigrants | Ireland | 99.2 /100 | #80 | Exceptional 5.7% |
| Immigrants | Jordan | 99.2 /100 | #81 | Exceptional 5.7% |
| Palestinians | 99.2 /100 | #82 | Exceptional 5.7% |