Scandinavian vs Immigrants from Czechoslovakia Disability
COMPARE
Scandinavian
Immigrants from Czechoslovakia
Disability
Disability Comparison
Scandinavians
Immigrants from Czechoslovakia
12.4%
DISABILITY
0.4/ 100
METRIC RATING
261st/ 347
METRIC RANK
11.2%
DISABILITY
97.4/ 100
METRIC RATING
99th/ 347
METRIC RANK
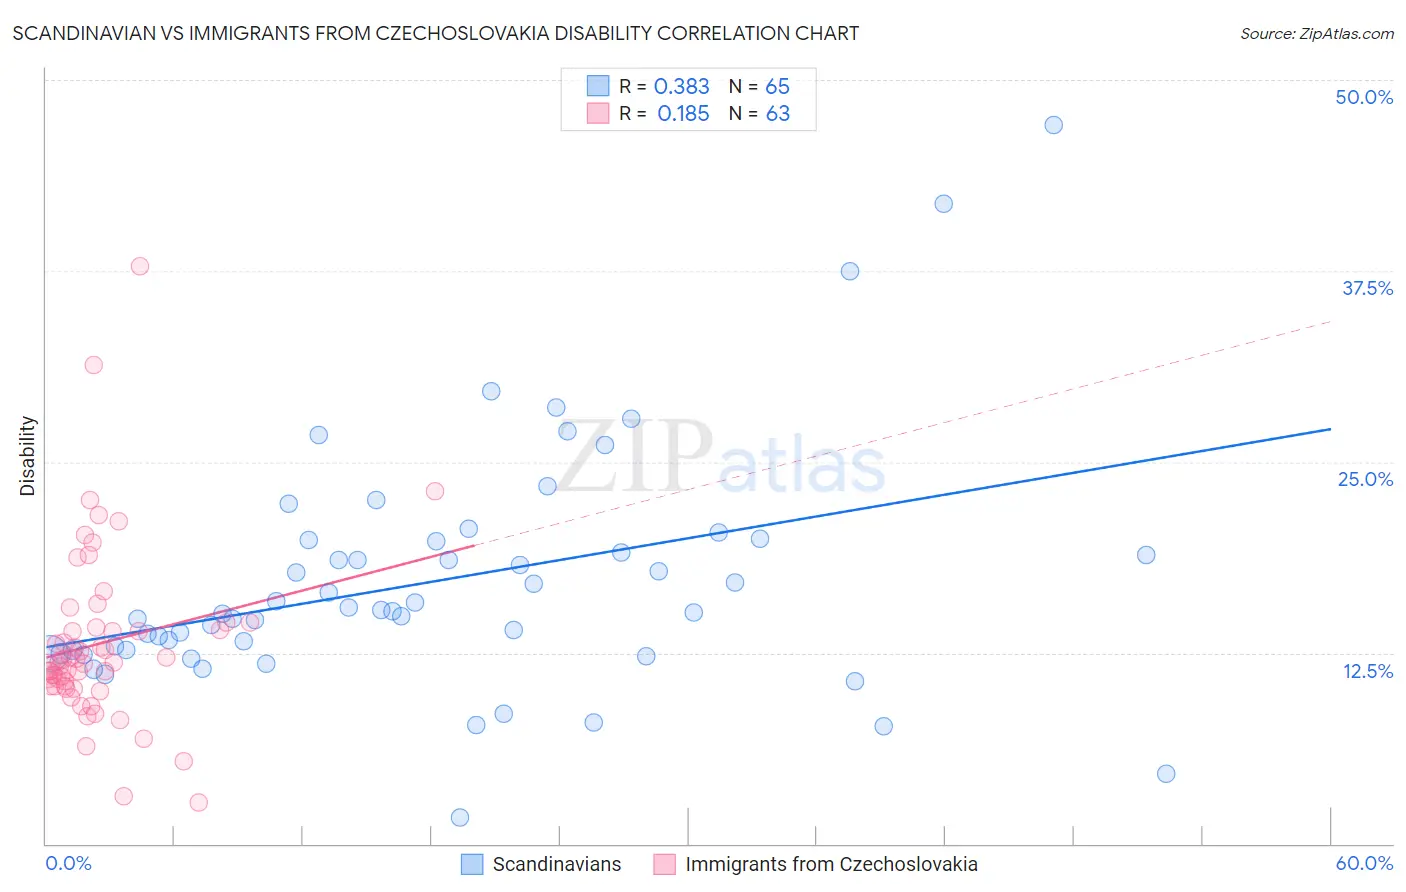
Scandinavian vs Immigrants from Czechoslovakia Disability Correlation Chart
The statistical analysis conducted on geographies consisting of 472,547,672 people shows a mild positive correlation between the proportion of Scandinavians and percentage of population with a disability in the United States with a correlation coefficient (R) of 0.383 and weighted average of 12.4%. Similarly, the statistical analysis conducted on geographies consisting of 195,454,618 people shows a poor positive correlation between the proportion of Immigrants from Czechoslovakia and percentage of population with a disability in the United States with a correlation coefficient (R) of 0.185 and weighted average of 11.2%, a difference of 10.5%.
Disability Correlation Summary
| Measurement | Scandinavian | Immigrants from Czechoslovakia |
| Minimum | 1.7% | 2.7% |
| Maximum | 47.1% | 37.8% |
| Range | 45.4% | 35.2% |
| Mean | 17.2% | 13.1% |
| Median | 15.2% | 11.9% |
| Interquartile 25% (IQ1) | 12.6% | 10.3% |
| Interquartile 75% (IQ3) | 19.9% | 14.2% |
| Interquartile Range (IQR) | 7.3% | 3.9% |
| Standard Deviation (Sample) | 7.9% | 5.7% |
| Standard Deviation (Population) | 7.8% | 5.7% |
Similar Demographics by Disability
Demographics Similar to Scandinavians by Disability
In terms of disability, the demographic groups most similar to Scandinavians are Immigrants from Liberia (12.4%, a difference of 0.070%), Canadian (12.4%, a difference of 0.10%), Slavic (12.4%, a difference of 0.16%), Native Hawaiian (12.5%, a difference of 0.27%), and Immigrants from Laos (12.4%, a difference of 0.30%).
| Demographics | Rating | Rank | Disability |
| German Russians | 0.8 /100 | #254 | Tragic 12.3% |
| Slovenes | 0.6 /100 | #255 | Tragic 12.4% |
| Immigrants | Dominica | 0.6 /100 | #256 | Tragic 12.4% |
| Immigrants | Laos | 0.5 /100 | #257 | Tragic 12.4% |
| Slavs | 0.5 /100 | #258 | Tragic 12.4% |
| Canadians | 0.4 /100 | #259 | Tragic 12.4% |
| Immigrants | Liberia | 0.4 /100 | #260 | Tragic 12.4% |
| Scandinavians | 0.4 /100 | #261 | Tragic 12.4% |
| Native Hawaiians | 0.3 /100 | #262 | Tragic 12.5% |
| Hawaiians | 0.2 /100 | #263 | Tragic 12.5% |
| Immigrants | Germany | 0.2 /100 | #264 | Tragic 12.5% |
| U.S. Virgin Islanders | 0.2 /100 | #265 | Tragic 12.5% |
| Czechoslovakians | 0.2 /100 | #266 | Tragic 12.5% |
| Spaniards | 0.2 /100 | #267 | Tragic 12.5% |
| Bangladeshis | 0.1 /100 | #268 | Tragic 12.6% |
Demographics Similar to Immigrants from Czechoslovakia by Disability
In terms of disability, the demographic groups most similar to Immigrants from Czechoslovakia are Bhutanese (11.2%, a difference of 0.010%), Uruguayan (11.2%, a difference of 0.010%), Immigrants from Zimbabwe (11.2%, a difference of 0.15%), Immigrants from Greece (11.3%, a difference of 0.18%), and Immigrants from Morocco (11.2%, a difference of 0.22%).
| Demographics | Rating | Rank | Disability |
| Ecuadorians | 98.0 /100 | #92 | Exceptional 11.2% |
| Immigrants | Ecuador | 98.0 /100 | #93 | Exceptional 11.2% |
| Immigrants | Morocco | 97.8 /100 | #94 | Exceptional 11.2% |
| Eastern Europeans | 97.8 /100 | #95 | Exceptional 11.2% |
| Immigrants | Zimbabwe | 97.7 /100 | #96 | Exceptional 11.2% |
| Bhutanese | 97.4 /100 | #97 | Exceptional 11.2% |
| Uruguayans | 97.4 /100 | #98 | Exceptional 11.2% |
| Immigrants | Czechoslovakia | 97.4 /100 | #99 | Exceptional 11.2% |
| Immigrants | Greece | 96.9 /100 | #100 | Exceptional 11.3% |
| Immigrants | Nicaragua | 96.8 /100 | #101 | Exceptional 11.3% |
| Immigrants | Eastern Africa | 96.7 /100 | #102 | Exceptional 11.3% |
| Immigrants | Uruguay | 96.4 /100 | #103 | Exceptional 11.3% |
| Immigrants | Immigrants | 96.4 /100 | #104 | Exceptional 11.3% |
| Immigrants | Kazakhstan | 96.4 /100 | #105 | Exceptional 11.3% |
| Immigrants | Eastern Europe | 96.3 /100 | #106 | Exceptional 11.3% |