Scandinavian vs Spanish American Indian Disability
COMPARE
Scandinavian
Spanish American Indian
Disability
Disability Comparison
Scandinavians
Spanish American Indians
12.4%
DISABILITY
0.4/ 100
METRIC RATING
261st/ 347
METRIC RANK
12.1%
DISABILITY
4.1/ 100
METRIC RATING
222nd/ 347
METRIC RANK
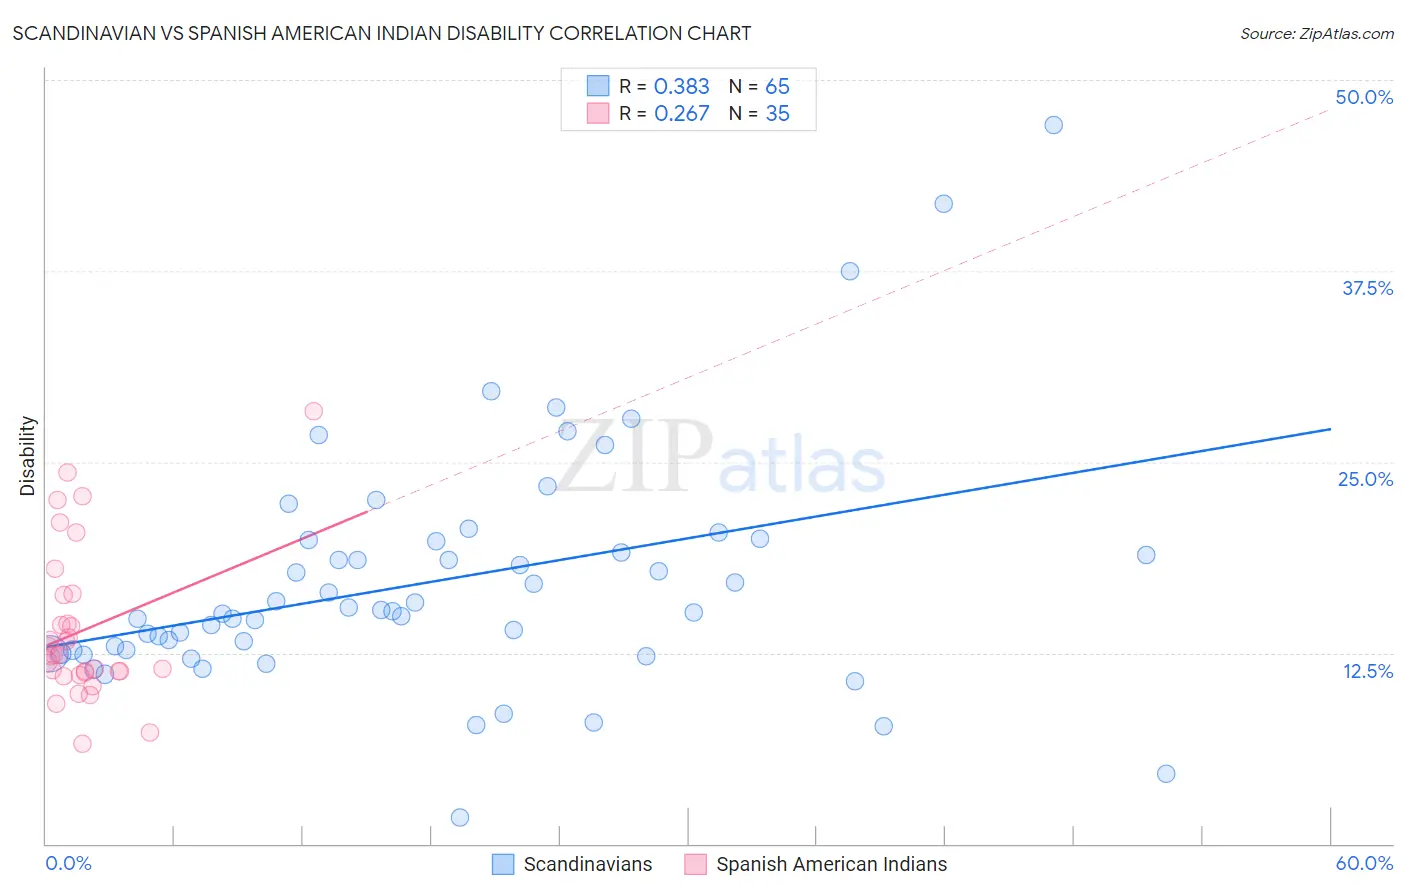
Scandinavian vs Spanish American Indian Disability Correlation Chart
The statistical analysis conducted on geographies consisting of 472,547,672 people shows a mild positive correlation between the proportion of Scandinavians and percentage of population with a disability in the United States with a correlation coefficient (R) of 0.383 and weighted average of 12.4%. Similarly, the statistical analysis conducted on geographies consisting of 73,149,525 people shows a weak positive correlation between the proportion of Spanish American Indians and percentage of population with a disability in the United States with a correlation coefficient (R) of 0.267 and weighted average of 12.1%, a difference of 2.5%.
Disability Correlation Summary
| Measurement | Scandinavian | Spanish American Indian |
| Minimum | 1.7% | 6.5% |
| Maximum | 47.1% | 28.3% |
| Range | 45.4% | 21.7% |
| Mean | 17.2% | 14.0% |
| Median | 15.2% | 12.3% |
| Interquartile 25% (IQ1) | 12.6% | 11.2% |
| Interquartile 75% (IQ3) | 19.9% | 16.3% |
| Interquartile Range (IQR) | 7.3% | 5.1% |
| Standard Deviation (Sample) | 7.9% | 4.9% |
| Standard Deviation (Population) | 7.8% | 4.9% |
Similar Demographics by Disability
Demographics Similar to Scandinavians by Disability
In terms of disability, the demographic groups most similar to Scandinavians are Immigrants from Liberia (12.4%, a difference of 0.070%), Canadian (12.4%, a difference of 0.10%), Slavic (12.4%, a difference of 0.16%), Native Hawaiian (12.5%, a difference of 0.27%), and Immigrants from Laos (12.4%, a difference of 0.30%).
| Demographics | Rating | Rank | Disability |
| German Russians | 0.8 /100 | #254 | Tragic 12.3% |
| Slovenes | 0.6 /100 | #255 | Tragic 12.4% |
| Immigrants | Dominica | 0.6 /100 | #256 | Tragic 12.4% |
| Immigrants | Laos | 0.5 /100 | #257 | Tragic 12.4% |
| Slavs | 0.5 /100 | #258 | Tragic 12.4% |
| Canadians | 0.4 /100 | #259 | Tragic 12.4% |
| Immigrants | Liberia | 0.4 /100 | #260 | Tragic 12.4% |
| Scandinavians | 0.4 /100 | #261 | Tragic 12.4% |
| Native Hawaiians | 0.3 /100 | #262 | Tragic 12.5% |
| Hawaiians | 0.2 /100 | #263 | Tragic 12.5% |
| Immigrants | Germany | 0.2 /100 | #264 | Tragic 12.5% |
| U.S. Virgin Islanders | 0.2 /100 | #265 | Tragic 12.5% |
| Czechoslovakians | 0.2 /100 | #266 | Tragic 12.5% |
| Spaniards | 0.2 /100 | #267 | Tragic 12.5% |
| Bangladeshis | 0.1 /100 | #268 | Tragic 12.6% |
Demographics Similar to Spanish American Indians by Disability
In terms of disability, the demographic groups most similar to Spanish American Indians are Northern European (12.1%, a difference of 0.040%), Hispanic or Latino (12.1%, a difference of 0.040%), Mexican (12.1%, a difference of 0.10%), Immigrants from Bahamas (12.1%, a difference of 0.16%), and Senegalese (12.1%, a difference of 0.18%).
| Demographics | Rating | Rank | Disability |
| Immigrants | Canada | 6.1 /100 | #215 | Tragic 12.1% |
| Panamanians | 5.4 /100 | #216 | Tragic 12.1% |
| Immigrants | North America | 5.3 /100 | #217 | Tragic 12.1% |
| Immigrants | Jamaica | 5.0 /100 | #218 | Tragic 12.1% |
| Croatians | 4.9 /100 | #219 | Tragic 12.1% |
| Immigrants | Bahamas | 4.7 /100 | #220 | Tragic 12.1% |
| Northern Europeans | 4.2 /100 | #221 | Tragic 12.1% |
| Spanish American Indians | 4.1 /100 | #222 | Tragic 12.1% |
| Hispanics or Latinos | 3.9 /100 | #223 | Tragic 12.1% |
| Mexicans | 3.7 /100 | #224 | Tragic 12.1% |
| Senegalese | 3.5 /100 | #225 | Tragic 12.1% |
| Jamaicans | 3.3 /100 | #226 | Tragic 12.1% |
| Alsatians | 3.3 /100 | #227 | Tragic 12.1% |
| West Indians | 2.9 /100 | #228 | Tragic 12.2% |
| Inupiat | 2.8 /100 | #229 | Tragic 12.2% |