Scandinavian vs Immigrants from Lithuania Disability
COMPARE
Scandinavian
Immigrants from Lithuania
Disability
Disability Comparison
Scandinavians
Immigrants from Lithuania
12.4%
DISABILITY
0.4/ 100
METRIC RATING
261st/ 347
METRIC RANK
10.9%
DISABILITY
99.8/ 100
METRIC RATING
56th/ 347
METRIC RANK
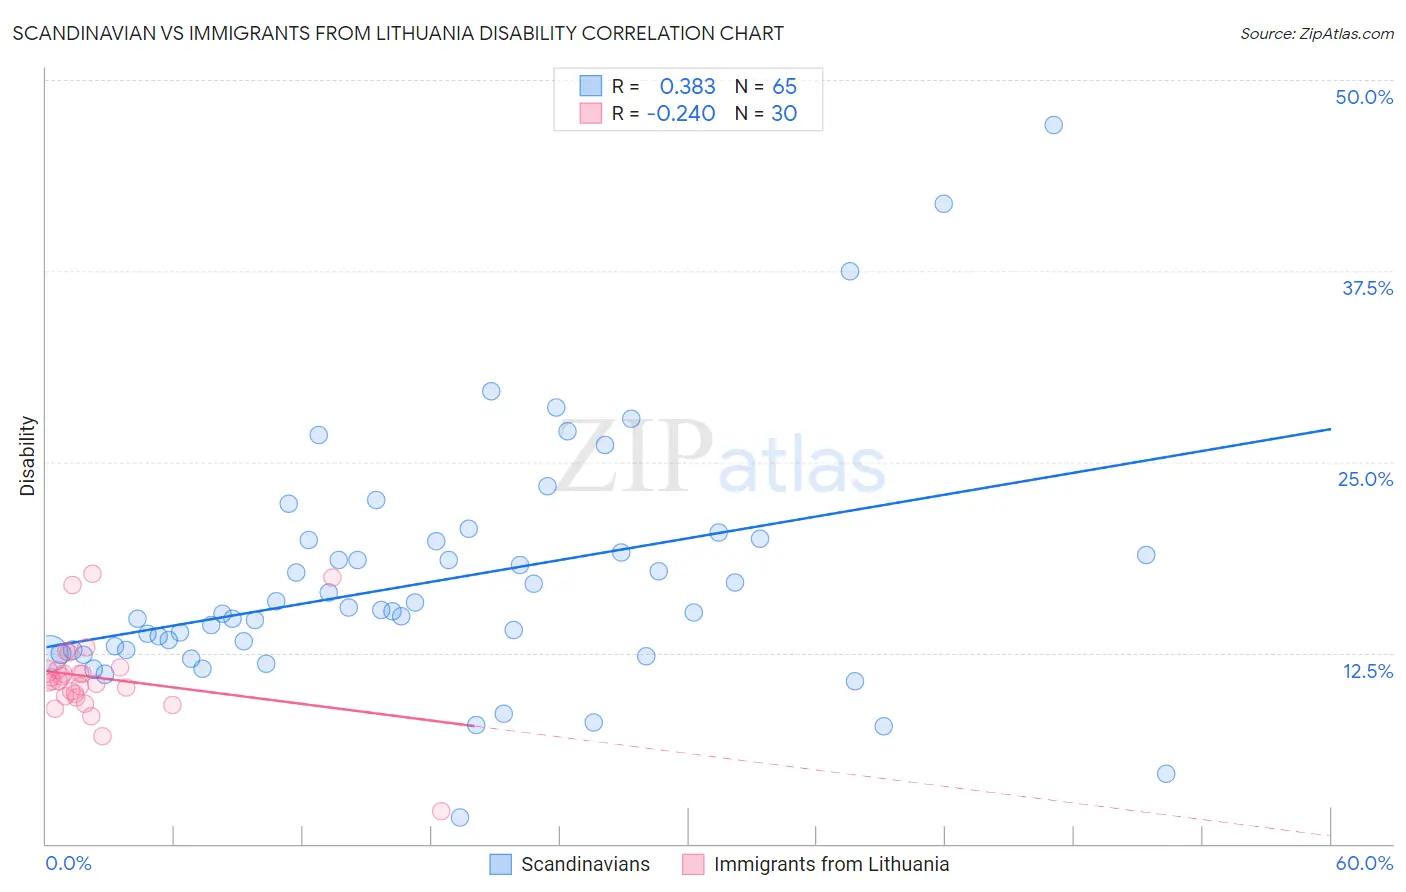
Scandinavian vs Immigrants from Lithuania Disability Correlation Chart
The statistical analysis conducted on geographies consisting of 472,547,672 people shows a mild positive correlation between the proportion of Scandinavians and percentage of population with a disability in the United States with a correlation coefficient (R) of 0.383 and weighted average of 12.4%. Similarly, the statistical analysis conducted on geographies consisting of 117,724,932 people shows a weak negative correlation between the proportion of Immigrants from Lithuania and percentage of population with a disability in the United States with a correlation coefficient (R) of -0.240 and weighted average of 10.9%, a difference of 14.0%.
Disability Correlation Summary
| Measurement | Scandinavian | Immigrants from Lithuania |
| Minimum | 1.7% | 2.1% |
| Maximum | 47.1% | 17.7% |
| Range | 45.4% | 15.5% |
| Mean | 17.2% | 10.9% |
| Median | 15.2% | 10.6% |
| Interquartile 25% (IQ1) | 12.6% | 9.6% |
| Interquartile 75% (IQ3) | 19.9% | 11.4% |
| Interquartile Range (IQR) | 7.3% | 1.7% |
| Standard Deviation (Sample) | 7.9% | 2.9% |
| Standard Deviation (Population) | 7.8% | 2.9% |
Similar Demographics by Disability
Demographics Similar to Scandinavians by Disability
In terms of disability, the demographic groups most similar to Scandinavians are Immigrants from Liberia (12.4%, a difference of 0.070%), Canadian (12.4%, a difference of 0.10%), Slavic (12.4%, a difference of 0.16%), Native Hawaiian (12.5%, a difference of 0.27%), and Immigrants from Laos (12.4%, a difference of 0.30%).
| Demographics | Rating | Rank | Disability |
| German Russians | 0.8 /100 | #254 | Tragic 12.3% |
| Slovenes | 0.6 /100 | #255 | Tragic 12.4% |
| Immigrants | Dominica | 0.6 /100 | #256 | Tragic 12.4% |
| Immigrants | Laos | 0.5 /100 | #257 | Tragic 12.4% |
| Slavs | 0.5 /100 | #258 | Tragic 12.4% |
| Canadians | 0.4 /100 | #259 | Tragic 12.4% |
| Immigrants | Liberia | 0.4 /100 | #260 | Tragic 12.4% |
| Scandinavians | 0.4 /100 | #261 | Tragic 12.4% |
| Native Hawaiians | 0.3 /100 | #262 | Tragic 12.5% |
| Hawaiians | 0.2 /100 | #263 | Tragic 12.5% |
| Immigrants | Germany | 0.2 /100 | #264 | Tragic 12.5% |
| U.S. Virgin Islanders | 0.2 /100 | #265 | Tragic 12.5% |
| Czechoslovakians | 0.2 /100 | #266 | Tragic 12.5% |
| Spaniards | 0.2 /100 | #267 | Tragic 12.5% |
| Bangladeshis | 0.1 /100 | #268 | Tragic 12.6% |
Demographics Similar to Immigrants from Lithuania by Disability
In terms of disability, the demographic groups most similar to Immigrants from Lithuania are Immigrants from El Salvador (10.9%, a difference of 0.11%), Immigrants from Spain (10.9%, a difference of 0.20%), Jordanian (10.9%, a difference of 0.20%), South American (10.9%, a difference of 0.22%), and Salvadoran (10.9%, a difference of 0.24%).
| Demographics | Rating | Rank | Disability |
| Vietnamese | 99.9 /100 | #49 | Exceptional 10.9% |
| Immigrants | Saudi Arabia | 99.9 /100 | #50 | Exceptional 10.9% |
| Peruvians | 99.8 /100 | #51 | Exceptional 10.9% |
| South Americans | 99.8 /100 | #52 | Exceptional 10.9% |
| Immigrants | Spain | 99.8 /100 | #53 | Exceptional 10.9% |
| Jordanians | 99.8 /100 | #54 | Exceptional 10.9% |
| Immigrants | El Salvador | 99.8 /100 | #55 | Exceptional 10.9% |
| Immigrants | Lithuania | 99.8 /100 | #56 | Exceptional 10.9% |
| Salvadorans | 99.8 /100 | #57 | Exceptional 10.9% |
| Immigrants | South America | 99.8 /100 | #58 | Exceptional 10.9% |
| Immigrants | Colombia | 99.7 /100 | #59 | Exceptional 10.9% |
| Zimbabweans | 99.7 /100 | #60 | Exceptional 10.9% |
| Immigrants | Bulgaria | 99.7 /100 | #61 | Exceptional 10.9% |
| Immigrants | Northern Africa | 99.7 /100 | #62 | Exceptional 10.9% |
| Immigrants | Eritrea | 99.7 /100 | #63 | Exceptional 11.0% |