Scandinavian vs Immigrants from Bosnia and Herzegovina Disability
COMPARE
Scandinavian
Immigrants from Bosnia and Herzegovina
Disability
Disability Comparison
Scandinavians
Immigrants from Bosnia and Herzegovina
12.4%
DISABILITY
0.4/ 100
METRIC RATING
261st/ 347
METRIC RANK
11.9%
DISABILITY
18.0/ 100
METRIC RATING
193rd/ 347
METRIC RANK
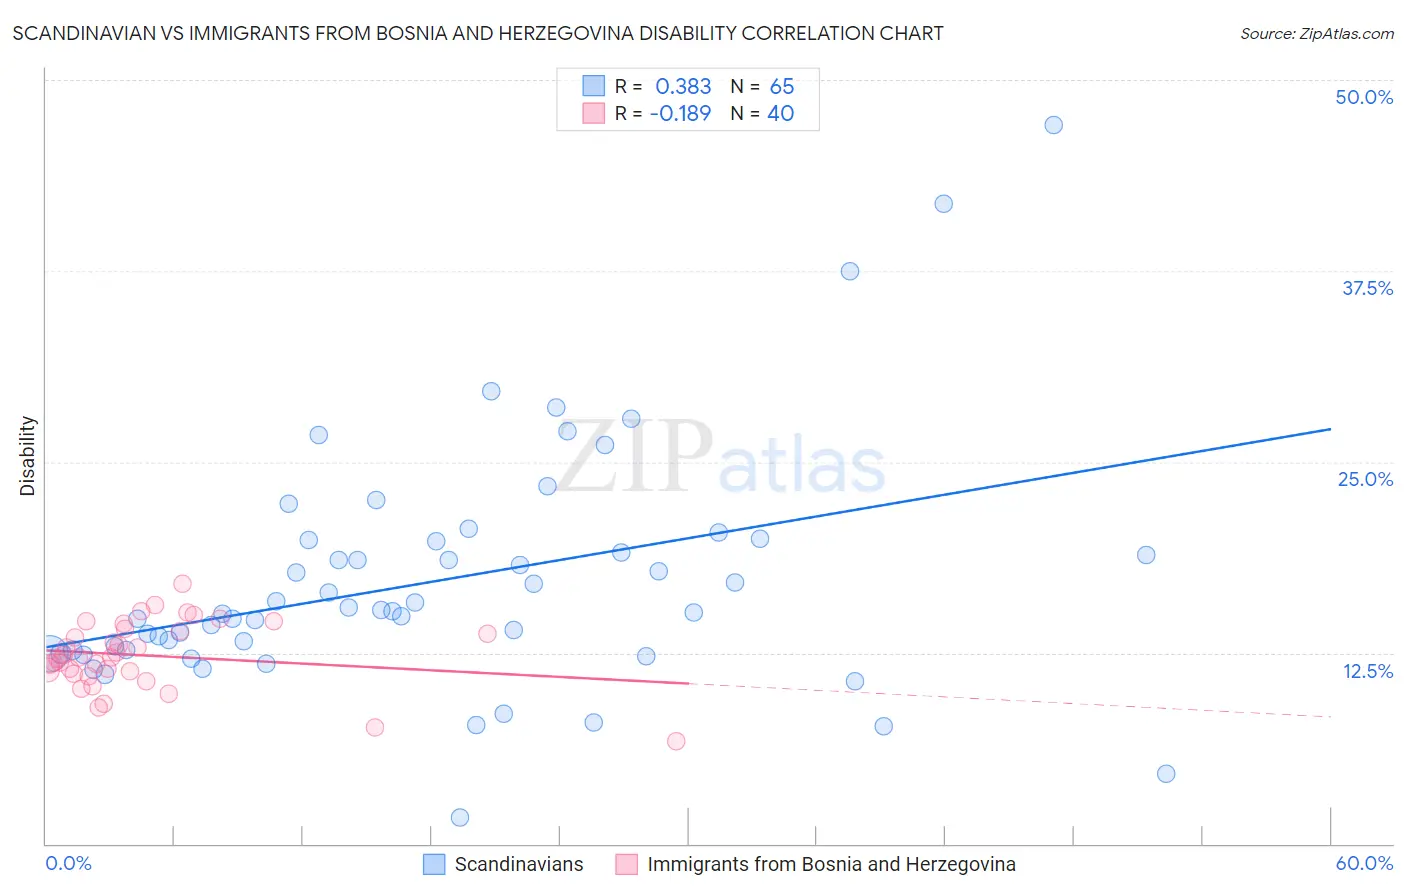
Scandinavian vs Immigrants from Bosnia and Herzegovina Disability Correlation Chart
The statistical analysis conducted on geographies consisting of 472,547,672 people shows a mild positive correlation between the proportion of Scandinavians and percentage of population with a disability in the United States with a correlation coefficient (R) of 0.383 and weighted average of 12.4%. Similarly, the statistical analysis conducted on geographies consisting of 156,819,615 people shows a poor negative correlation between the proportion of Immigrants from Bosnia and Herzegovina and percentage of population with a disability in the United States with a correlation coefficient (R) of -0.189 and weighted average of 11.9%, a difference of 4.4%.
Disability Correlation Summary
| Measurement | Scandinavian | Immigrants from Bosnia and Herzegovina |
| Minimum | 1.7% | 6.7% |
| Maximum | 47.1% | 17.0% |
| Range | 45.4% | 10.3% |
| Mean | 17.2% | 12.3% |
| Median | 15.2% | 12.2% |
| Interquartile 25% (IQ1) | 12.6% | 11.2% |
| Interquartile 75% (IQ3) | 19.9% | 14.0% |
| Interquartile Range (IQR) | 7.3% | 2.8% |
| Standard Deviation (Sample) | 7.9% | 2.2% |
| Standard Deviation (Population) | 7.8% | 2.2% |
Similar Demographics by Disability
Demographics Similar to Scandinavians by Disability
In terms of disability, the demographic groups most similar to Scandinavians are Immigrants from Liberia (12.4%, a difference of 0.070%), Canadian (12.4%, a difference of 0.10%), Slavic (12.4%, a difference of 0.16%), Native Hawaiian (12.5%, a difference of 0.27%), and Immigrants from Laos (12.4%, a difference of 0.30%).
| Demographics | Rating | Rank | Disability |
| German Russians | 0.8 /100 | #254 | Tragic 12.3% |
| Slovenes | 0.6 /100 | #255 | Tragic 12.4% |
| Immigrants | Dominica | 0.6 /100 | #256 | Tragic 12.4% |
| Immigrants | Laos | 0.5 /100 | #257 | Tragic 12.4% |
| Slavs | 0.5 /100 | #258 | Tragic 12.4% |
| Canadians | 0.4 /100 | #259 | Tragic 12.4% |
| Immigrants | Liberia | 0.4 /100 | #260 | Tragic 12.4% |
| Scandinavians | 0.4 /100 | #261 | Tragic 12.4% |
| Native Hawaiians | 0.3 /100 | #262 | Tragic 12.5% |
| Hawaiians | 0.2 /100 | #263 | Tragic 12.5% |
| Immigrants | Germany | 0.2 /100 | #264 | Tragic 12.5% |
| U.S. Virgin Islanders | 0.2 /100 | #265 | Tragic 12.5% |
| Czechoslovakians | 0.2 /100 | #266 | Tragic 12.5% |
| Spaniards | 0.2 /100 | #267 | Tragic 12.5% |
| Bangladeshis | 0.1 /100 | #268 | Tragic 12.6% |
Demographics Similar to Immigrants from Bosnia and Herzegovina by Disability
In terms of disability, the demographic groups most similar to Immigrants from Bosnia and Herzegovina are Lithuanian (11.9%, a difference of 0.050%), Somali (11.9%, a difference of 0.050%), Ute (11.9%, a difference of 0.10%), Barbadian (11.9%, a difference of 0.17%), and Immigrants from West Indies (11.9%, a difference of 0.21%).
| Demographics | Rating | Rank | Disability |
| Immigrants | Scotland | 28.2 /100 | #186 | Fair 11.8% |
| Lebanese | 27.9 /100 | #187 | Fair 11.8% |
| Immigrants | Mexico | 23.8 /100 | #188 | Fair 11.9% |
| Immigrants | Zaire | 21.8 /100 | #189 | Fair 11.9% |
| Immigrants | West Indies | 21.1 /100 | #190 | Fair 11.9% |
| Ute | 19.5 /100 | #191 | Poor 11.9% |
| Lithuanians | 18.8 /100 | #192 | Poor 11.9% |
| Immigrants | Bosnia and Herzegovina | 18.0 /100 | #193 | Poor 11.9% |
| Somalis | 17.3 /100 | #194 | Poor 11.9% |
| Barbadians | 15.8 /100 | #195 | Poor 11.9% |
| Serbians | 15.4 /100 | #196 | Poor 11.9% |
| Immigrants | Belize | 15.2 /100 | #197 | Poor 11.9% |
| Ukrainians | 14.7 /100 | #198 | Poor 11.9% |
| Immigrants | Panama | 14.6 /100 | #199 | Poor 11.9% |
| Belizeans | 12.8 /100 | #200 | Poor 11.9% |